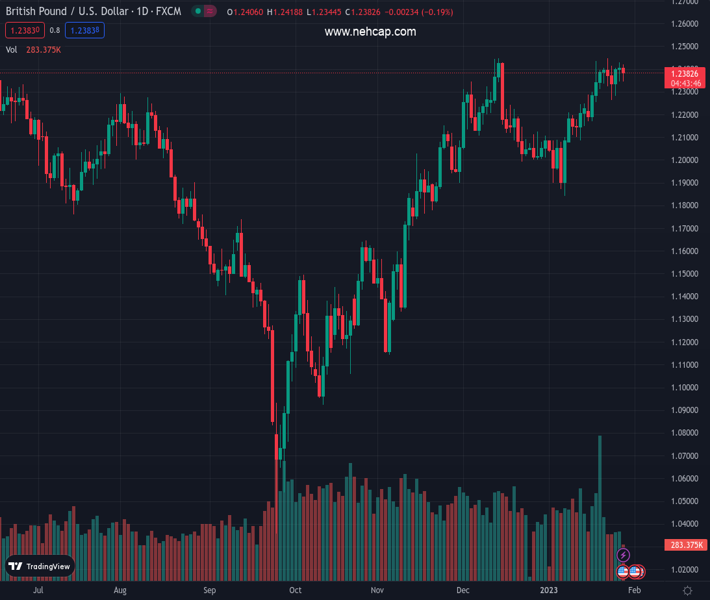
#GBPUSD @ 1.23830 is set to finish Friday with losses of at least 0.20%. (Pivot Orderbook analysis)
…
This is a premium post.
[s2If !current_user_can(access_s2member_level4)]Please register for PREMIUM VERSION HERE to read full post below containing analysis. In case of any error or you think you are not able to read the full post below, please email us at support#nehcap.com [lwa][/s2If] [s2If current_user_can(access_s2member_level4)]
- GBP/USD is set to finish Friday with losses of at least 0.20%.
- United States inflation continues to wane but remains twice elevated of Fed’s target.
- GBP/USD Price Analysis: To remain sideways ahead of the Fed and BoE monetary policy decisions.
The pair currently trades last at 1.23830.
The previous day high was 1.243 while the previous day low was 1.2344. The daily 38.2% Fib levels comes at 1.2398, expected to provide resistance. Similarly, the daily 61.8% fib level is at 1.2377, expected to provide support.
GBP/USD snaps two days of gains and tumbled below Thursday’s close of 1.2406, slumping toward 1.2370, amidst a choppy trading session. Inflation data revealed in the United States (US) augmented the likelihood of small-size rate hikes by the US Federal Reserve. Therefore, the GBP/USD is trading at 1.2372, below its opening price by 0.27%.
US equities turned mixed as of writing. The US Federal Reserve (Fed) preferred gauge for inflation, the Core Personal Consumption Expenditure (PCE) for December, climbed 4.4% YoY, lower than November’s 4.7%, cementing the Fed’s cause of lower the size of subsequent interest rate increases, throughout the remainder of the year. Headline inflation rose by 5% YoY, well above the Fed’s target of 2%.
Even though data showed that inflation is cooling down, the US GDP for Q4 released on Thursday could exacerbate officials from slowing the pace of rate increases.
In the meantime, the University of Michigan (UoM) Consumer Sentiment on its final reading for January rose by 64.9, above expectations of 64.6. The poll showed that The survey conducted by the University of Michigan updated inflation expectations, with a one-year horizon estimated at 3.9%, while for a 5-year rose to 2.9% compared to the preliminary 3.0%,
Across the pond, the UK docket showed that economic activity fell at its fastest pace in two years in January, as reported by a survey on Tuesday. Meanwhile, the Bank of England (BoE) is expected to raise rates by 50 bps on February 2, lifting the Bank Rate to 4%. Even though that would bolster the Pound Sterling (GBP), speculations grew that it could probably be the last hike in the BoE’s tightening cycle.
After the GBP/USD failed to break above/below the weekly range, price action would remain sideways, ahead of central bank decisions, next week. Therefore, the GBP/USD trading range for next Monday to Wednesday before the Fed meeting would likely be 1.2340/1.2430, Oscillators suggest that buying pressure is cooling, with the Relative Strength Index (RSI) aiming down, though at bearish territory. The Rate of Change (RoC) portrays volatility levels as almost unchanged.
If the GBP/USD breaks above 1.2430, that could pave the way towards 1.2500, but firstly bulls need to clear 1.2450. On the flip side, a fall of the GBP/USD beneath 1.2340 could put the 1.2300 figure into play. Break below, and the pair might test the 20-day Exponential Moving Average (EMA) at 1.2267.
Technical Levels: Supports and Resistances
GBPUSD currently trading at 1.2377 at the time of writing. Pair opened at 1.2414 and is trading with a change of -0.3 % .
| Overview | Overview.1 | |
|---|---|---|
| 0 | Today last price | 1.2377 |
| 1 | Today Daily Change | -0.0037 |
| 2 | Today Daily Change % | -0.3000 |
| 3 | Today daily open | 1.2414 |
The pair remains strongly bullish on the daily timeframe. It trades above its 20 SMA @ 1.2211, 50 SMA 1.2153, 100 SMA @ 1.1758 and 200 SMA @ 1.1965.
| Trends | Trends.1 | |
|---|---|---|
| 0 | Daily SMA20 | 1.2211 |
| 1 | Daily SMA50 | 1.2153 |
| 2 | Daily SMA100 | 1.1758 |
| 3 | Daily SMA200 | 1.1965 |
The previous day high was 1.243 while the previous day low was 1.2344. The daily 38.2% Fib levels comes at 1.2398, expected to provide resistance. Similarly, the daily 61.8% fib level is at 1.2377, expected to provide support.
Note the levels of interest below:
- Pivot support is noted at 1.2362, 1.2311, 1.2277
- Pivot resistance is noted at 1.2448, 1.2482, 1.2534
| Levels | Levels.1 |
|---|---|
| Previous Daily High | 1.2430 |
| Previous Daily Low | 1.2344 |
| Previous Weekly High | 1.2436 |
| Previous Weekly Low | 1.2169 |
| Previous Monthly High | 1.2447 |
| Previous Monthly Low | 1.1992 |
| Daily Fibonacci 38.2% | 1.2398 |
| Daily Fibonacci 61.8% | 1.2377 |
| Daily Pivot Point S1 | 1.2362 |
| Daily Pivot Point S2 | 1.2311 |
| Daily Pivot Point S3 | 1.2277 |
| Daily Pivot Point R1 | 1.2448 |
| Daily Pivot Point R2 | 1.2482 |
| Daily Pivot Point R3 | 1.2534 |
[/s2If]
Join Our Telegram Group


