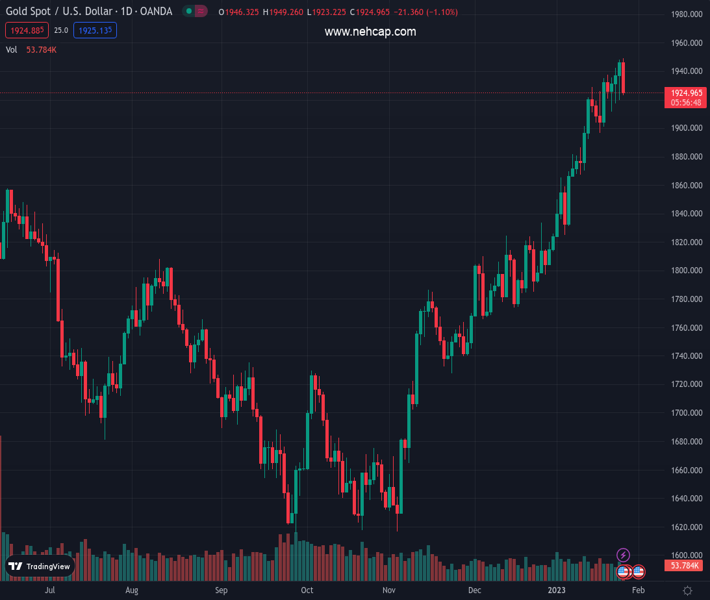
#XAUUSD @ 1,923.83 Gold price drops more than 0.60% due to profit-taking and upbeat US economic data. (Pivot Orderbook analysis)
…
This is a premium post.
[s2If !current_user_can(access_s2member_level4)]Please register for PREMIUM VERSION HERE to read full post below containing analysis. In case of any error or you think you are not able to read the full post below, please email us at support#nehcap.com [lwa][/s2If] [s2If current_user_can(access_s2member_level4)]
- Gold price drops more than 0.60% due to profit-taking and upbeat US economic data.
- US Gross Domestic Product for Q4 beat estimates, while unemployment claims fell.
- Durable Good Orders jumped while new orders shrank.
The pair currently trades last at 1923.83.
The previous day high was 1948.17 while the previous day low was 1919.91. The daily 38.2% Fib levels comes at 1937.37, expected to provide resistance. Similarly, the daily 61.8% fib level is at 1930.71, expected to provide resistance.
Gold price retreats after hitting a nine-month high of $1949.16 and dips beneath the $1940 mark, following the release of the Gross Domestic Product (GDP) preliminary reading in the United States (US), amongst other data. Therefore, the XAU/USD is trading at 1933.40, below the opening price by 0.49%.
US equity futures rose on the release of Q4’s GDP, while Gold extended its losses. The US economy grew at a solid 2.9% QoQ, above estimates of 2.6%, while for Q3, it rose 3.2%, in data revealed by the US Commerce Department. Meanwhile, for the entire year of 2022, the US economy expanded by 2.1%, less than the 5.9% registered in 2021. The report highlighted that consumer spending was the main driver of economic growth at the start of Q4. Spending remains underpinned by a robust labor market and excess savings.
At the same time, the US Department of Labor (DoL) reported that Initial Jobless Claims for the week ending on January 21 dropped 6K to a seasonally adjusted 186K, below the estimates of 205 K. In other data, Durable Good Orders rebounded from a -2.1% contraction in November to 5.6% in December, as data for the US Commerce Department showed. However, core New Orders contracted by -0.1% MoM, aligned with the consensus, as the US economy feels the pain of 425 basis points (bps) of tightening by the US Federal Reserve (Fed).
Friday, the US economic docket will feature the US Federal Reserve preferred gauge for inflation, the Core Personal Consumption Expenditures (PCE), with the monthly reading estimated at 0.3%, while annually based is foreseen at 4.4%. Headline PCE data is expected at 0.1% Mom and 5.5% YoY.
The XAU/USD daily chart remains upward biased, although an ongoing correction might push prices towards the $1900 psychological level or to the January 18 daily low of $1896.74. Below that support, the 20-day Exponential Moving Average (EMA) rests at $1894.44, which, once cleared, could send XAU/USD diving toward the January 11 pivot low of $1867.22. As an alternate scenario, if XAU/USD reclaims $1950, a move toward the psychological $2000 level is on the cards.
Technical Levels: Supports and Resistances
XAUUSD currently trading at 1933.51 at the time of writing. Pair opened at 1946.73 and is trading with a change of -0.68 % .
| Overview | Overview.1 | |
|---|---|---|
| 0 | Today last price | 1933.51 |
| 1 | Today Daily Change | -13.22 |
| 2 | Today Daily Change % | -0.68 |
| 3 | Today daily open | 1946.73 |
The pair remains strongly bullish on the daily timeframe. It trades above its 20 SMA @ 1885.23, 50 SMA 1822.32, 100 SMA @ 1750.98 and 200 SMA @ 1775.61.
| Trends | Trends.1 | |
|---|---|---|
| 0 | Daily SMA20 | 1885.23 |
| 1 | Daily SMA50 | 1822.32 |
| 2 | Daily SMA100 | 1750.98 |
| 3 | Daily SMA200 | 1775.61 |
The previous day high was 1948.17 while the previous day low was 1919.91. The daily 38.2% Fib levels comes at 1937.37, expected to provide resistance. Similarly, the daily 61.8% fib level is at 1930.71, expected to provide resistance.
Note the levels of interest below:
- Pivot support is noted at 1928.37, 1910.01, 1900.11
- Pivot resistance is noted at 1956.63, 1966.53, 1984.89
| Levels | Levels.1 |
|---|---|
| Previous Daily High | 1948.17 |
| Previous Daily Low | 1919.91 |
| Previous Weekly High | 1937.57 |
| Previous Weekly Low | 1896.63 |
| Previous Monthly High | 1833.38 |
| Previous Monthly Low | 1765.89 |
| Daily Fibonacci 38.2% | 1937.37 |
| Daily Fibonacci 61.8% | 1930.71 |
| Daily Pivot Point S1 | 1928.37 |
| Daily Pivot Point S2 | 1910.01 |
| Daily Pivot Point S3 | 1900.11 |
| Daily Pivot Point R1 | 1956.63 |
| Daily Pivot Point R2 | 1966.53 |
| Daily Pivot Point R3 | 1984.89 |
[/s2If]
Join Our Telegram Group


