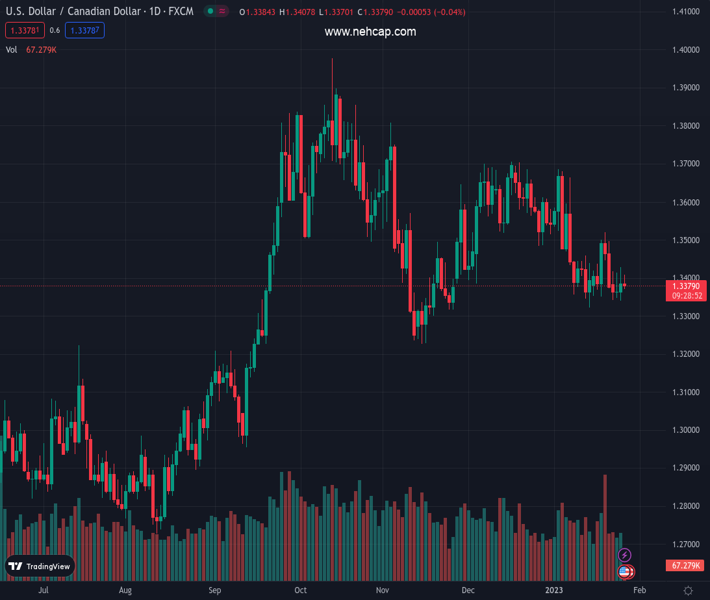
#USDCAD @ 1.33785 surrenders modest intraday gains and slides back below the 1.3400 mark. (Pivot Orderbook analysis)
…
This is a premium post.
[s2If !current_user_can(access_s2member_level4)]Please register for PREMIUM VERSION HERE to read full post below containing analysis. In case of any error or you think you are not able to read the full post below, please email us at support#nehcap.com [lwa][/s2If] [s2If current_user_can(access_s2member_level4)]
- USD/CAD surrenders modest intraday gains and slides back below the 1.3400 mark.
- An uptick in oil prices underpins the Loonie and acts as a headwind for the major.
- A modest USD strength should limit the downside ahead of the US Q4 GDP report.
The pair currently trades last at 1.33785.
The previous day high was 1.3428 while the previous day low was 1.334. The daily 38.2% Fib levels comes at 1.3394, expected to provide resistance. Similarly, the daily 61.8% fib level is at 1.3374, expected to provide support.
The USD/CAD pair struggles to capitalize on its modest intraday gains and retreats to the lower end of the daily range, below the 1.3400 mark heading into the North American session.
As investors look past the Bank of Canada’s dovish decision on Wednesday, a modest uptick in crude oil prices underpins the commodity-linked Loonie and acts as a headwind for the USD/CAD pair. Hopes for a strong fuel demand recovery in the world’s top oil importer China, along with the lower-than-expected rise in US crude inventories, lend some support to the black liquid. That said, worries about a deeper global economic downturn keep a lid on oil prices.
Apart from this, a modest US Dollar strength should limit any meaningful downside for the USD/CAD pair, at least for the time being. Looming recession risks continue to weigh on investors’ sentiment, which is evident from a generally softer tone around the equity markets. Furthermore, an intraday pickup in the US Treasury bond yields assists the safe-haven greenback to recover from an eight-month low amid some repositioning trade ahead of the US Q4 GDP print.
That said, firming expectations for a less aggressive policy tightening by the Fed should cap the US bond yields and hold back the USD bulls on the defensive. In fact, the CME’s FedWatch Tool points to over a 90% probability for a 25 bps rate hike at the upcoming FOMC meeting next week. This, in turn, warrants some caution before placing aggressive bullish bets around the USD/CAD pair and positioning for an extension of the overnight bounce from a nearly two-week low.
The focus, meanwhile, remains glued to the release of the Preliminary (first estimate) US Q4 GDP print. Thursday’s US economic docket also features Durable Goods Orders and New Home Sales data. This, along with the US bond yields and the broader risk sentiment, will drive the USD demand and provide some impetus to the USD/CAD pair. Apart from this, traders will take cues from oil price dynamics to grab short-term opportunities around the major.
Technical Levels: Supports and Resistances
USDCAD currently trading at 1.3376 at the time of writing. Pair opened at 1.3385 and is trading with a change of -0.07 % .
| Overview | Overview.1 | |
|---|---|---|
| 0 | Today last price | 1.3376 |
| 1 | Today Daily Change | -0.0009 |
| 2 | Today Daily Change % | -0.0700 |
| 3 | Today daily open | 1.3385 |
The pair is trading below its 20 Daily moving average @ 1.3455, below its 50 Daily moving average @ 1.3504 , below its 100 Daily moving average @ 1.352 and above its 200 Daily moving average @ 1.3202
| Trends | Trends.1 | |
|---|---|---|
| 0 | Daily SMA20 | 1.3455 |
| 1 | Daily SMA50 | 1.3504 |
| 2 | Daily SMA100 | 1.3520 |
| 3 | Daily SMA200 | 1.3202 |
The previous day high was 1.3428 while the previous day low was 1.334. The daily 38.2% Fib levels comes at 1.3394, expected to provide resistance. Similarly, the daily 61.8% fib level is at 1.3374, expected to provide support.
Note the levels of interest below:
- Pivot support is noted at 1.3341, 1.3296, 1.3253
- Pivot resistance is noted at 1.3429, 1.3472, 1.3517
| Levels | Levels.1 |
|---|---|
| Previous Daily High | 1.3428 |
| Previous Daily Low | 1.3340 |
| Previous Weekly High | 1.3521 |
| Previous Weekly Low | 1.3351 |
| Previous Monthly High | 1.3705 |
| Previous Monthly Low | 1.3385 |
| Daily Fibonacci 38.2% | 1.3394 |
| Daily Fibonacci 61.8% | 1.3374 |
| Daily Pivot Point S1 | 1.3341 |
| Daily Pivot Point S2 | 1.3296 |
| Daily Pivot Point S3 | 1.3253 |
| Daily Pivot Point R1 | 1.3429 |
| Daily Pivot Point R2 | 1.3472 |
| Daily Pivot Point R3 | 1.3517 |
[/s2If]
Join Our Telegram Group


