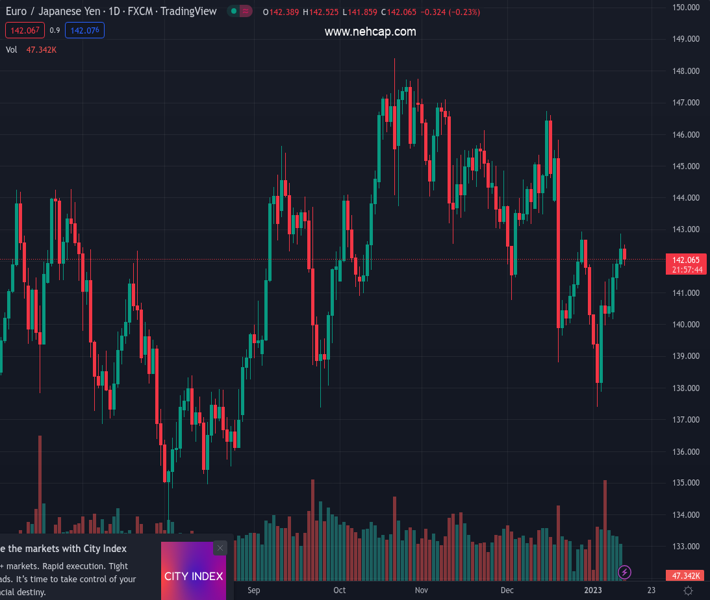
#EURJPY @ 142.056 stalls its rally and clashes with a confluence of technical indicators. (Pivot Orderbook analysis)
…
This is a premium post.
[s2If !current_user_can(access_s2member_level4)]Please register for PREMIUM VERSION HERE to read full post below containing analysis. In case of any error or you think you are not able to read the full post below, please email us at support#nehcap.com [lwa][/s2If] [s2If current_user_can(access_s2member_level4)]
- EUR/JPY stalls its rally and clashes with a confluence of technical indicators.
- A break below the 20-day EMA could pave the way toward the 200-day EMA at 140.24.
- EUR buyers reclaiming 142.00 would set the stage to challenge the 100-day EMA.
The pair currently trades last at 142.056.
The previous day high was 142.05 while the previous day low was 141.08. The daily 38.2% Fib levels comes at 141.68, expected to provide support. Similarly, the daily 61.8% fib level is at 141.45, expected to provide support.
The EUR/JPY gained some traction during the Wednesday session and reached a new two-week high at 142.85 before reversing its course and closed at 142.39. As Thursday’s Asian Pacific session begins, the EUR/JPY continues the late downtrend, registering decent losses of 0.14%, and trades at 142.12 at the time of writing.
After piercing the EUR/JPY 50-day Exponential Moving Average (EMA) at 142.50, and the 100-day at 142.21, the cross-currency reversed its course, snapping four days of straight gains. Nevertheless, to resume its downtrend in the short-term, the EUR/JPY needs to clear the 20-day EMA at 141.65, which, once surpassed, the pair could fall towards the 141.00 mark, ahead of the 200-day EMA at 140.24.
The previously-mentioned scenario is backed by oscillators, with the Relative Strength Index (RSI), although at bullish territory, its slope is downwards, about to cross under the 50-midline. In contrast, the Rate of Change (RoC) portrays upside volatility as higher. Therefore, EUR/JPY traders might refrain from opening fresh EUR short positions until the RoC shifts bearish.
As an alternative scenario, if the EUR/JPY resumes its uptrend, key resistance levels are the 100-day EMA at 142.21, followed by the 50-day EMA at 142.50, and then the 143.00 mark.
Technical Levels: Supports and Resistances
EURJPY currently trading at 141.95 at the time of writing. Pair opened at 141.97 and is trading with a change of -0.01 % .
| Overview | Overview.1 | |
|---|---|---|
| 0 | Today last price | 141.95 |
| 1 | Today Daily Change | -0.02 |
| 2 | Today Daily Change % | -0.01 |
| 3 | Today daily open | 141.97 |
The pair is trading above its 20 Daily moving average @ 141.67, below its 50 Daily moving average @ 143.35 , below its 100 Daily moving average @ 143.03 and above its 200 Daily moving average @ 140.62
| Trends | Trends.1 | |
|---|---|---|
| 0 | Daily SMA20 | 141.67 |
| 1 | Daily SMA50 | 143.35 |
| 2 | Daily SMA100 | 143.03 |
| 3 | Daily SMA200 | 140.62 |
The previous day high was 142.05 while the previous day low was 141.08. The daily 38.2% Fib levels comes at 141.68, expected to provide support. Similarly, the daily 61.8% fib level is at 141.45, expected to provide support.
Note the levels of interest below:
- Pivot support is noted at 141.35, 140.73, 140.39
- Pivot resistance is noted at 142.32, 142.67, 143.29
| Levels | Levels.1 |
|---|---|
| Previous Daily High | 142.05 |
| Previous Daily Low | 141.08 |
| Previous Weekly High | 141.45 |
| Previous Weekly Low | 137.39 |
| Previous Monthly High | 146.73 |
| Previous Monthly Low | 138.80 |
| Daily Fibonacci 38.2% | 141.68 |
| Daily Fibonacci 61.8% | 141.45 |
| Daily Pivot Point S1 | 141.35 |
| Daily Pivot Point S2 | 140.73 |
| Daily Pivot Point S3 | 140.39 |
| Daily Pivot Point R1 | 142.32 |
| Daily Pivot Point R2 | 142.67 |
| Daily Pivot Point R3 | 143.29 |
[/s2If]
Join Our Telegram Group


