#XAGUSD @ 23.300 is under pressure after breaking short-term support levels during the American session. (Pivot Orderbook analysis)
…
This is a premium post.
[s2If !current_user_can(access_s2member_level4)]Please register for PREMIUM VERSION HERE to read full post below containing analysis. In case of any error or you think you are not able to read the full post below, please email us at support#nehcap.com [lwa][/s2If] [s2If current_user_can(access_s2member_level4)]
- XAG/USD is under pressure after breaking short-term support levels during the American session.
- The metal is under pressure, approaching the $23.00 level.
- US Dollar mixed as equity prices rises modestly.
The pair currently trades last at 23.300.
The previous day high was 23.77 while the previous day low was 23.43. The daily 38.2% Fib levels comes at 23.56, expected to provide resistance. Similarly, the daily 61.8% fib level is at 23.64, expected to provide resistance.
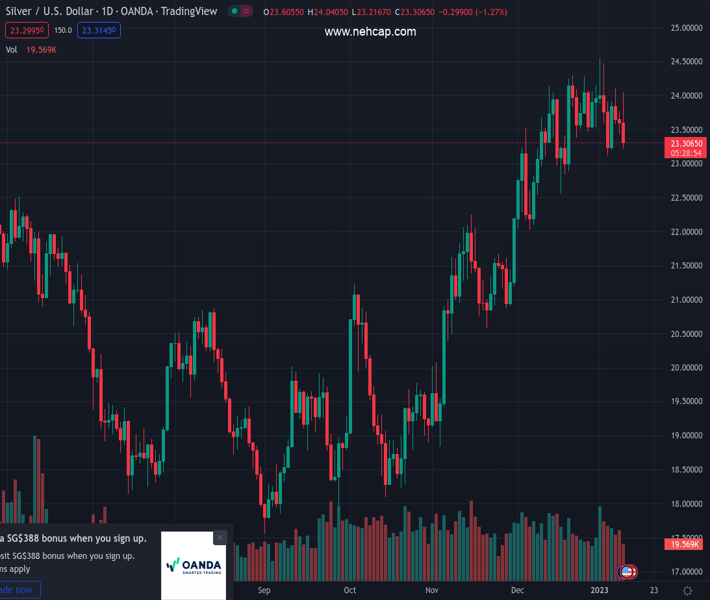
Silver is under pressure during Wednesday’s American session, trading at the lowest level since Friday, near $23.20. The white metal is falling by 1.25%, getting closer to January lows.
Earlier on Wednesday, XAG/USD reached levels above $24.00 but it was rejected and started to move lower. The decline gained speed during the American session and after breaking short-term horizontal and dynamic supports.
Silver price is back under the 20-day Simple Moving Average (SMA), today at $23.60. The mentioned SMA is turning south, suggesting some exhaustion to the upside. The short-term bias is turning to the downside. All could change it XAG/USD manages to rise and hold above $24.00, particularly with a daily close above $24.20.
On the downside, the next target is at the January low at $23.10. Below $23.00 the next support level is seen at $22.80.
Technical Levels: Supports and Resistances
XAGUSD currently trading at 23.33 at the time of writing. Pair opened at 23.62 and is trading with a change of -1.23 % .
| Overview | Overview.1 | |
|---|---|---|
| 0 | Today last price | 23.33 |
| 1 | Today Daily Change | -0.29 |
| 2 | Today Daily Change % | -1.23 |
| 3 | Today daily open | 23.62 |
The pair is trading below its 20 Daily moving average @ 23.69, above its 50 Daily moving average @ 22.48 , above its 100 Daily moving average @ 20.8 and above its 200 Daily moving average @ 21.09
| Trends | Trends.1 | |
|---|---|---|
| 0 | Daily SMA20 | 23.69 |
| 1 | Daily SMA50 | 22.48 |
| 2 | Daily SMA100 | 20.80 |
| 3 | Daily SMA200 | 21.09 |
The previous day high was 23.77 while the previous day low was 23.43. The daily 38.2% Fib levels comes at 23.56, expected to provide resistance. Similarly, the daily 61.8% fib level is at 23.64, expected to provide resistance.
Note the levels of interest below:
- Pivot support is noted at 23.45, 23.27, 23.1
- Pivot resistance is noted at 23.79, 23.95, 24.13
| Levels | Levels.1 |
|---|---|
| Previous Daily High | 23.77 |
| Previous Daily Low | 23.43 |
| Previous Weekly High | 24.55 |
| Previous Weekly Low | 23.12 |
| Previous Monthly High | 24.30 |
| Previous Monthly Low | 22.03 |
| Daily Fibonacci 38.2% | 23.56 |
| Daily Fibonacci 61.8% | 23.64 |
| Daily Pivot Point S1 | 23.45 |
| Daily Pivot Point S2 | 23.27 |
| Daily Pivot Point S3 | 23.10 |
| Daily Pivot Point R1 | 23.79 |
| Daily Pivot Point R2 | 23.95 |
| Daily Pivot Point R3 | 24.13 |
[/s2If]
Join Our Telegram Group


