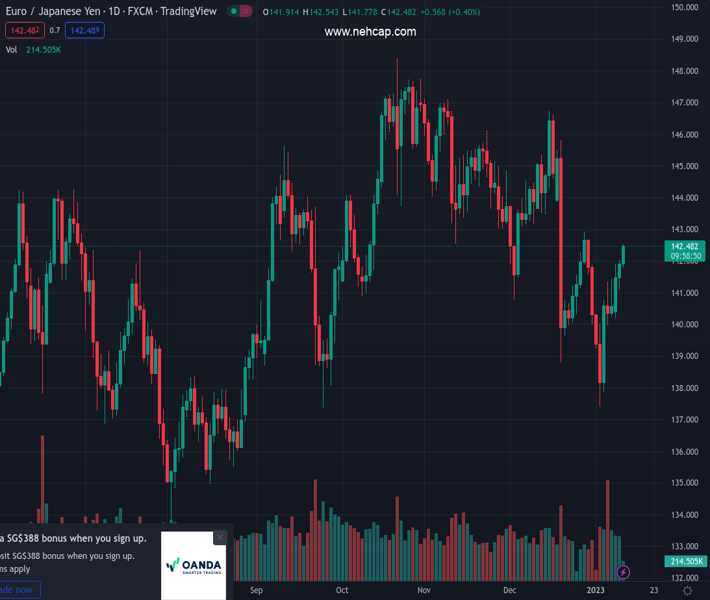
#EURJPY @ 142.496 advances further north of the 142.00 mark midweek (Pivot Orderbook analysis)
…
This is a premium post.
[s2If !current_user_can(access_s2member_level4)]Please register for PREMIUM VERSION HERE to read full post below containing analysis. In case of any error or you think you are not able to read the full post below, please email us at support#nehcap.com [lwa][/s2If] [s2If current_user_can(access_s2member_level4)]
- EUR/JPY advances further north of the 142.00 mark midweek
- Bulls now target the weekly high around the 143.00 zone (December 28).
The pair currently trades last at 142.496.
The previous day high was 142.05 while the previous day low was 141.08. The daily 38.2% Fib levels comes at 141.68, expected to provide support. Similarly, the daily 61.8% fib level is at 141.45, expected to provide support.
EUR/JPY trades with gains for the fourth session in a row and climbs to multi-day peaks near 142.50 on Wednesday.
Considering the ongoing price action, further upside remains well favoured in the near term. Against that, the immediate up barrier appears at the weekly high at 142.93 (December 28), which appears reinforced by the vicinity of the 100-day SMA, today at 143.05.
The outlook for EUR/JPY should remain positive while above the 200-day SMA at 140.62.
Technical Levels: Supports and Resistances
EURJPY currently trading at 142.52 at the time of writing. Pair opened at 141.97 and is trading with a change of 0.39 % .
| Overview | Overview.1 | |
|---|---|---|
| 0 | Today last price | 142.52 |
| 1 | Today Daily Change | 77.00 |
| 2 | Today Daily Change % | 0.39 |
| 3 | Today daily open | 141.97 |
The pair is trading above its 20 Daily moving average @ 141.67, below its 50 Daily moving average @ 143.35 , below its 100 Daily moving average @ 143.03 and above its 200 Daily moving average @ 140.62
| Trends | Trends.1 | |
|---|---|---|
| 0 | Daily SMA20 | 141.67 |
| 1 | Daily SMA50 | 143.35 |
| 2 | Daily SMA100 | 143.03 |
| 3 | Daily SMA200 | 140.62 |
The previous day high was 142.05 while the previous day low was 141.08. The daily 38.2% Fib levels comes at 141.68, expected to provide support. Similarly, the daily 61.8% fib level is at 141.45, expected to provide support.
Note the levels of interest below:
- Pivot support is noted at 141.35, 140.73, 140.39
- Pivot resistance is noted at 142.32, 142.67, 143.29
| Levels | Levels.1 |
|---|---|
| Previous Daily High | 142.05 |
| Previous Daily Low | 141.08 |
| Previous Weekly High | 141.45 |
| Previous Weekly Low | 137.39 |
| Previous Monthly High | 146.73 |
| Previous Monthly Low | 138.80 |
| Daily Fibonacci 38.2% | 141.68 |
| Daily Fibonacci 61.8% | 141.45 |
| Daily Pivot Point S1 | 141.35 |
| Daily Pivot Point S2 | 140.73 |
| Daily Pivot Point S3 | 140.39 |
| Daily Pivot Point R1 | 142.32 |
| Daily Pivot Point R2 | 142.67 |
| Daily Pivot Point R3 | 143.29 |
[/s2If]
Join Our Telegram Group


