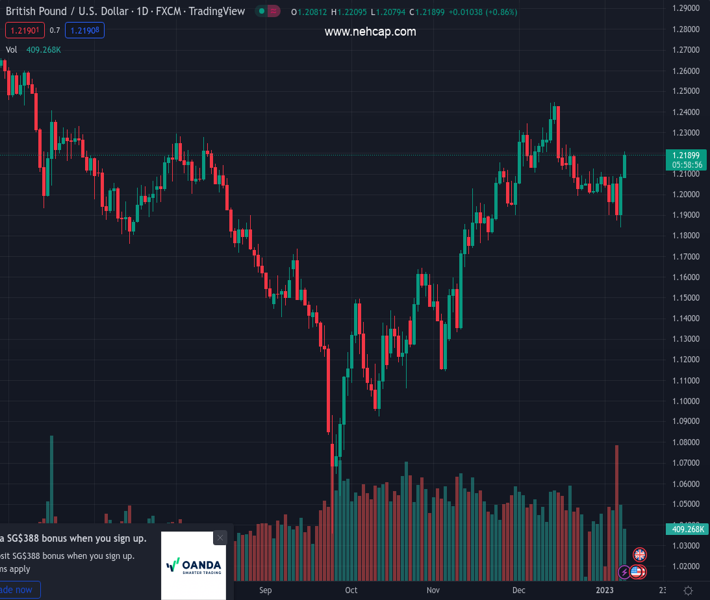
#GBPUSD @ 1.21927 The pierces the 200-day EMA and distance from it, rallying above the 1.2200 figure. (Pivot Orderbook analysis)
…
This is a premium post.
[s2If !current_user_can(access_s2member_level4)]Please register for PREMIUM VERSION HERE to read full post below containing analysis. In case of any error or you think you are not able to read the full post below, please email us at support#nehcap.com [lwa][/s2If] [s2If current_user_can(access_s2member_level4)]
- The GBP/USD pierces the 200-day EMA and distance from it, rallying above the 1.2200 figure.
- Investors are eyeing the United States inflation report on Thursday.
- GBP/USD Price Analysis: A daily close above 1.2200 to pave the way toward 1.2300.
The pair currently trades last at 1.21927.
The previous day high was 1.21 while the previous day low was 1.1841. The daily 38.2% Fib levels comes at 1.2001, expected to provide support. Similarly, the daily 61.8% fib level is at 1.194, expected to provide support.
The Pound Sterling (GBP) advances against the US Dollar (USD) early in the North American session due to an upbeat market mood on speculations that the US Federal Reserve (Fed) would slowdown rate hikes in a week that an inflation report in the United States is the spotlight. At the time of writing, the GBP/USD is trading at 1.2205.
Wall Street opens with solid gains. An absent US economic docket on Monday keeps traders adrift to UK news. As reported by Reuters, UK Prime Minister Rishi Sunak said that inflation is not guaranteed to decline in 2022 and that the government would need to be disciplined to curb inflation. Regarding strikes and other themes, UK’s PM Sunak added that he was willing to discuss pay increases for nurses in an effort to finish strikes.
In the meantime, Bank of England (BoE) policymakers led by Catherine Mann said that energy price caps could bring inflation up in other sectors as it could boost consumer spending. She added that what would happen to inflation is unclear when lids are removed.
At the time of typing, the BoE Chief Economist Huw Pill said that the BoE would continue to act to reach the inflation target, saying that the Monetary Policy Committee (MPC) “will respond forcefully” if needed. Pill stated that domestic prices and wages are key to the MPC outlook.
After breaching the 200-day Exponential Moving Average (EMA), the GBP/USD closes toward the 1.2200 mark, printing a three-week new high. The twelve-day consolidation period appears to end, and if the GBP/USD clears the 1.2200 figure, that could pave the way for December’s 19 daily high of 1.2242, which, once cleared, could open the door for a rally to 1.2300.
Oscillators like the Relative Strength Index (RSI) show buyers gathering momentum, while the Rate of Change (RoC) woke up and aimed higher after showing lower levels of volatility.
Technical Levels: Supports and Resistances
GBPUSD currently trading at 1.2206 at the time of writing. Pair opened at 1.2095 and is trading with a change of 0.92 % .
| Overview | Overview.1 | |
|---|---|---|
| 0 | Today last price | 1.2206 |
| 1 | Today Daily Change | 0.0111 |
| 2 | Today Daily Change % | 0.9200 |
| 3 | Today daily open | 1.2095 |
The pair remains strongly bullish on the daily timeframe. It trades above its 20 SMA @ 1.2111, 50 SMA 1.1957, 100 SMA @ 1.1669 and 200 SMA @ 1.2019.
| Trends | Trends.1 | |
|---|---|---|
| 0 | Daily SMA20 | 1.2111 |
| 1 | Daily SMA50 | 1.1957 |
| 2 | Daily SMA100 | 1.1669 |
| 3 | Daily SMA200 | 1.2019 |
The previous day high was 1.21 while the previous day low was 1.1841. The daily 38.2% Fib levels comes at 1.2001, expected to provide support. Similarly, the daily 61.8% fib level is at 1.194, expected to provide support.
Note the levels of interest below:
- Pivot support is noted at 1.1925, 1.1754, 1.1667
- Pivot resistance is noted at 1.2183, 1.227, 1.2441
| Levels | Levels.1 |
|---|---|
| Previous Daily High | 1.2100 |
| Previous Daily Low | 1.1841 |
| Previous Weekly High | 1.2102 |
| Previous Weekly Low | 1.1841 |
| Previous Monthly High | 1.2447 |
| Previous Monthly Low | 1.1992 |
| Daily Fibonacci 38.2% | 1.2001 |
| Daily Fibonacci 61.8% | 1.1940 |
| Daily Pivot Point S1 | 1.1925 |
| Daily Pivot Point S2 | 1.1754 |
| Daily Pivot Point S3 | 1.1667 |
| Daily Pivot Point R1 | 1.2183 |
| Daily Pivot Point R2 | 1.2270 |
| Daily Pivot Point R3 | 1.2441 |
[/s2If]
Join Our Telegram Group


