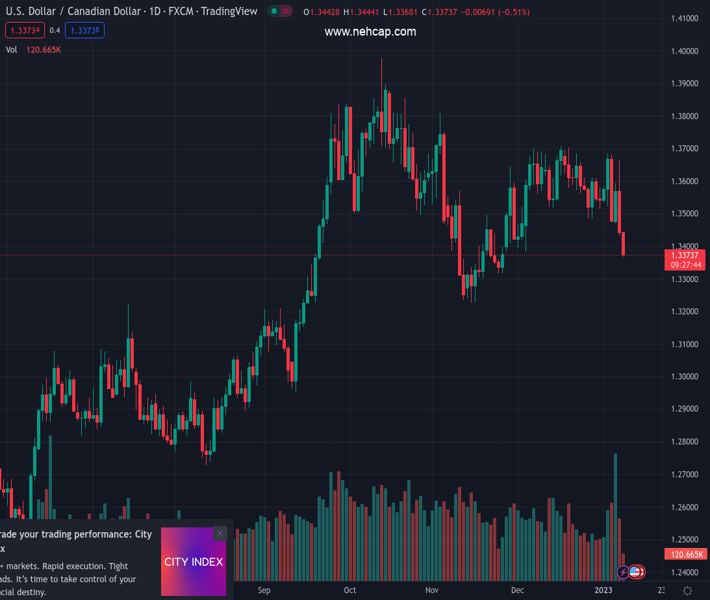
#USDCAD @ 1.33799 drops to a seven-week low on Monday and is pressured by a combination of factors. (Pivot Orderbook analysis)
…
This is a premium post.
[s2If !current_user_can(access_s2member_level4)]Please register for PREMIUM VERSION HERE to read full post below containing analysis. In case of any error or you think you are not able to read the full post below, please email us at support#nehcap.com [lwa][/s2If] [s2If current_user_can(access_s2member_level4)]
- USD/CAD drops to a seven-week low on Monday and is pressured by a combination of factors.
- An intraday rally in crude oil prices underpins the Loonie and exerts pressure amid a weaker USD.
- Diminishing odds for more aggressive Fed rate hikes and the risk-on mood weigh on the buck.
The pair currently trades last at 1.33799.
The previous day high was 1.3664 while the previous day low was 1.3433. The daily 38.2% Fib levels comes at 1.3522, expected to provide resistance. Similarly, the daily 61.8% fib level is at 1.3576, expected to provide resistance.
The USD/CAD pair remains under heavy selling pressure for the second straight day and drops to its lowest level since late November heading into the North American session on Monday. The pair is currently placed around the 1.3380-1.3375 region, down nearly 0.50% for the day, and is pressured by a combination of factors.
The Canadian Dollar continues to draw support from Friday’s upbeat domestic employment details, which raised expectations for additional rate hikes by the Bank of Canada. Adding to this, a strong intraday rally of over 3% in crude oil prices, bolstered by China’s biggest pivot away from its strict zero-COVID policy, underpins the commodity-linked Loonie. This, along with sustained US Dollar selling bias, contributes to the offered tone surrounding the USD/CAD pair and the ongoing downward trajectory.
The mixed US monthly jobs report (NFP) and the disappointing release of the US ISM Services PMI on Friday lifted bets for a less aggressive policy tightening by the Fed. In fact, the markets are now pricing in a 25 bps Fed rate hike move in February, which is reinforced by a further decline in the US Treasury bond yields. Furthermore, a generally positive tone around the equity markets is also seen denting the greenback’s relative safe-haven status and exerting additional pressure on the USD/CAD pair.
That said, worries about a deeper global economic downturn keep a lid on the optimism in the markets, which could help limit losses for the USD. Nevertheless, the USD/CAD pair confirms a bearish breakdown below a technically significant 100-day SMA. Moreover, a subsequent slide below the 1.3400 mark could be seen as a fresh trigger for bearish traders. In the absence of any relevant market-moving macro data, either from the US or Canada, this supports prospects for a further depreciating move for the pair.
Technical Levels: Supports and Resistances
USDCAD currently trading at 1.3376 at the time of writing. Pair opened at 1.3444 and is trading with a change of -0.51 % .
| Overview | Overview.1 | |
|---|---|---|
| 0 | Today last price | 1.3376 |
| 1 | Today Daily Change | -0.0068 |
| 2 | Today Daily Change % | -0.5100 |
| 3 | Today daily open | 1.3444 |
The pair is trading below its 20 Daily moving average @ 1.3588, below its 50 Daily moving average @ 1.3522 , below its 100 Daily moving average @ 1.3476 and above its 200 Daily moving average @ 1.3148
| Trends | Trends.1 | |
|---|---|---|
| 0 | Daily SMA20 | 1.3588 |
| 1 | Daily SMA50 | 1.3522 |
| 2 | Daily SMA100 | 1.3476 |
| 3 | Daily SMA200 | 1.3148 |
The previous day high was 1.3664 while the previous day low was 1.3433. The daily 38.2% Fib levels comes at 1.3522, expected to provide resistance. Similarly, the daily 61.8% fib level is at 1.3576, expected to provide resistance.
Note the levels of interest below:
- Pivot support is noted at 1.3364, 1.3283, 1.3132
- Pivot resistance is noted at 1.3595, 1.3745, 1.3826
| Levels | Levels.1 |
|---|---|
| Previous Daily High | 1.3664 |
| Previous Daily Low | 1.3433 |
| Previous Weekly High | 1.3685 |
| Previous Weekly Low | 1.3433 |
| Previous Monthly High | 1.3705 |
| Previous Monthly Low | 1.3385 |
| Daily Fibonacci 38.2% | 1.3522 |
| Daily Fibonacci 61.8% | 1.3576 |
| Daily Pivot Point S1 | 1.3364 |
| Daily Pivot Point S2 | 1.3283 |
| Daily Pivot Point S3 | 1.3132 |
| Daily Pivot Point R1 | 1.3595 |
| Daily Pivot Point R2 | 1.3745 |
| Daily Pivot Point R3 | 1.3826 |
[/s2If]
Join Our Telegram Group


