The index extends the decline and retest the mid-103.00s. (Pivot Orderbook analysis)
…
This is a premium post.
[s2If !current_user_can(access_s2member_level4)]Please register for PREMIUM VERSION HERE to read full post below containing analysis. In case of any error or you think you are not able to read the full post below, please email us at support#nehcap.com [lwa][/s2If] [s2If current_user_can(access_s2member_level4)]
- The index extends the decline and retest the mid-103.00s.
- The loss of this region could accelerate losses to 101.30.
The pair currently trades last at 103.61.
The previous day high was 105.63 while the previous day low was 103.87. The daily 38.2% Fib levels comes at 104.54, expected to provide resistance. Similarly, the daily 61.8% fib level is at 104.96, expected to provide resistance.
DXY remains on the defensive and poked with the key support region around 103.50 at the beginning of the week.
The breach of that contention area could spark a deeper retracement to, initially, the May 2022 low around 101.30 (May 30) ahead of the psychological 100.00 yardstick.
In the meantime, while below the 200-day SMA, the outlook for the index should remain tilted to the negative side.
Technical Levels: Supports and Resistances
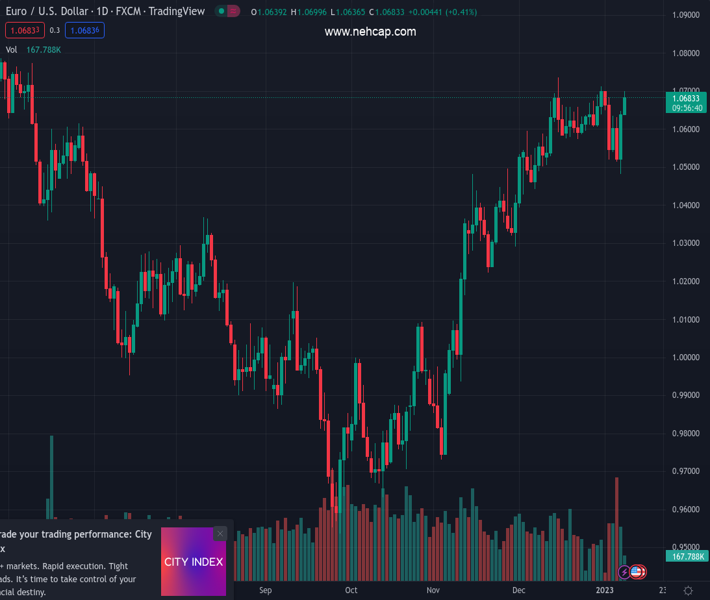
EURUSD currently trading at 103.61 at the time of writing. Pair opened at 103.9 and is trading with a change of -0.28 % .
| Overview | Overview.1 | |
|---|---|---|
| 0 | Today last price | 103.61 |
| 1 | Today Daily Change | 51.00 |
| 2 | Today Daily Change % | -0.28 |
| 3 | Today daily open | 103.90 |
The pair remains strongly bearish on the daily time frame. It trades below the 20 SMA @ 104.29, 50 SMA 105.3, 100 SMA @ 108.28 and 200 SMA @ 106.79.
| Trends | Trends.1 | |
|---|---|---|
| 0 | Daily SMA20 | 104.29 |
| 1 | Daily SMA50 | 105.30 |
| 2 | Daily SMA100 | 108.28 |
| 3 | Daily SMA200 | 106.79 |
The previous day high was 105.63 while the previous day low was 103.87. The daily 38.2% Fib levels comes at 104.54, expected to provide resistance. Similarly, the daily 61.8% fib level is at 104.96, expected to provide resistance.
Note the levels of interest below:
- Pivot support is noted at 103.3, 102.7, 101.54
- Pivot resistance is noted at 105.06, 106.22, 106.82
| Levels | Levels.1 |
|---|---|
| Previous Daily High | 105.63 |
| Previous Daily Low | 103.87 |
| Previous Weekly High | 105.63 |
| Previous Weekly Low | 103.43 |
| Previous Monthly High | 106.02 |
| Previous Monthly Low | 103.39 |
| Daily Fibonacci 38.2% | 104.54 |
| Daily Fibonacci 61.8% | 104.96 |
| Daily Pivot Point S1 | 103.30 |
| Daily Pivot Point S2 | 102.70 |
| Daily Pivot Point S3 | 101.54 |
| Daily Pivot Point R1 | 105.06 |
| Daily Pivot Point R2 | 106.22 |
| Daily Pivot Point R3 | 106.82 |
[/s2If]
Join Our Telegram Group


