#XAGUSD @ 23.140 Solid US employment data augmented speculations for further Fed tightening. (Pivot Orderbook analysis)
…
This is a premium post.
[s2If !current_user_can(access_s2member_level4)]Please register for PREMIUM VERSION HERE to read full post below containing analysis. In case of any error or you think you are not able to read the full post below, please email us at support#nehcap.com [lwa][/s2If] [s2If current_user_can(access_s2member_level4)]
- Solid US employment data augmented speculations for further Fed tightening.
- The US Dollar remains bolstered by high US Treasury bond yields, which weigh on Silver prices.
- US Nonfarm Payrolls eyed, as Fed officials forecasted a jump in the Unemployment Rate to 4.6% in 2023.
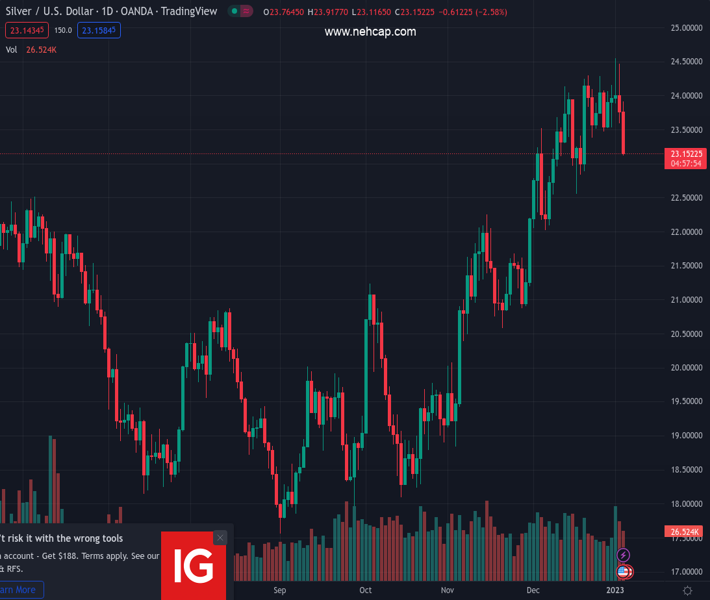
The pair currently trades last at 23.140.
The previous day high was 24.46 while the previous day low was 23.59. The daily 38.2% Fib levels comes at 23.92, expected to provide resistance. Similarly, the daily 61.8% fib level is at 24.13, expected to provide resistance.
Silver price extended its losses for the second consecutive day after hitting a nine-month high around $24.54 on Tuesday, plunging more than 2%. Robust labor market data in the United States (US) increased speculations for further tightening by the Federal Reserve (Fed), as shown by US Treasury yields rising. Therefore, the XAG/USD is trading at $23.20 after hitting a daily high of $23.91.
US employment data dampened traders’ mood. Private hiring increased in December, as the ADP Employment Change report showed the US economy added 2345K jobs crushing estimates. Some minutes following the release, the US Department of Labor (DoL) revealed that Initial Jobless Claims for the last week fell to their lowest level since late September, at 204K vs. 225K estimated. The same report flashed Continuing Claims contracting to 1.694M less than the 1.708M expected.
At the same time, the US Department of Commerce (DoC) revealed that the US Trade Balance for December shrank its deficit, printing $-61.51B against the $-73.0B foreseen.
Moving aside from the releases of US data, the XAG/USD extended its losses after opening on the back foot since the Asian session. During the European session, Silver dropped to its daily low at 23.18 though it bounced back to the $23.60 area. Nevertheless, once American traders got to their desks, the US Dollar (USD) resumed its uptrend, to the detriment of dollar-denominated commodities.
The US Dollar Index (DXY), which tracks the value of the American Dollar against a basket of six currencies, is gaining 0.86%, back above the 105.000 mark, one factor that keeps the precious metals pressured. In the same tone, US Treasury bond yields are recovering some ground, with the US 10-year benchmark note rate up five bps at 3.739%, a headwind for the white metal.
Elsewhere, US Fed officials Esther George and Raphael Bostic had crossed the newswires. Kansas City Fed President Esther George said that high inflation requires Fed action, while his colleague, Atlanta’s Fed President Raphael Bostic, added that inflation is the biggest headwind for the US economy.
Ahead into the week, the US economy docket will feature the US Nonfarm Payrolls report, with most bank analysts estimating an increase of just 200K in December. Investors should be aware that the latest Fed Summary of Economic Projections (SEP) forecasts a growth in the Unemployment Rate to 4.6%, but December estimates surround the 3.7%. Misses to the downside should be viewed as positive for the USD, as it will suggest further rate hikes are needed.
Technical Levels: Supports and Resistances
XAGUSD currently trading at 23.21 at the time of writing. Pair opened at 23.78 and is trading with a change of -2.4 % .
| Overview | Overview.1 | |
|---|---|---|
| 0 | Today last price | 23.21 |
| 1 | Today Daily Change | -0.57 |
| 2 | Today Daily Change % | -2.40 |
| 3 | Today daily open | 23.78 |
The pair is trading below its 20 Daily moving average @ 23.65, above its 50 Daily moving average @ 22.15 , above its 100 Daily moving average @ 20.63 and above its 200 Daily moving average @ 21.11
| Trends | Trends.1 | |
|---|---|---|
| 0 | Daily SMA20 | 23.65 |
| 1 | Daily SMA50 | 22.15 |
| 2 | Daily SMA100 | 20.63 |
| 3 | Daily SMA200 | 21.11 |
The previous day high was 24.46 while the previous day low was 23.59. The daily 38.2% Fib levels comes at 23.92, expected to provide resistance. Similarly, the daily 61.8% fib level is at 24.13, expected to provide resistance.
Note the levels of interest below:
- Pivot support is noted at 23.43, 23.07, 22.56
- Pivot resistance is noted at 24.3, 24.81, 25.16
| Levels | Levels.1 |
|---|---|
| Previous Daily High | 24.46 |
| Previous Daily Low | 23.59 |
| Previous Weekly High | 24.28 |
| Previous Weekly Low | 23.46 |
| Previous Monthly High | 24.30 |
| Previous Monthly Low | 22.03 |
| Daily Fibonacci 38.2% | 23.92 |
| Daily Fibonacci 61.8% | 24.13 |
| Daily Pivot Point S1 | 23.43 |
| Daily Pivot Point S2 | 23.07 |
| Daily Pivot Point S3 | 22.56 |
| Daily Pivot Point R1 | 24.30 |
| Daily Pivot Point R2 | 24.81 |
| Daily Pivot Point R3 | 25.16 |
[/s2If]
Join Our Telegram Group


