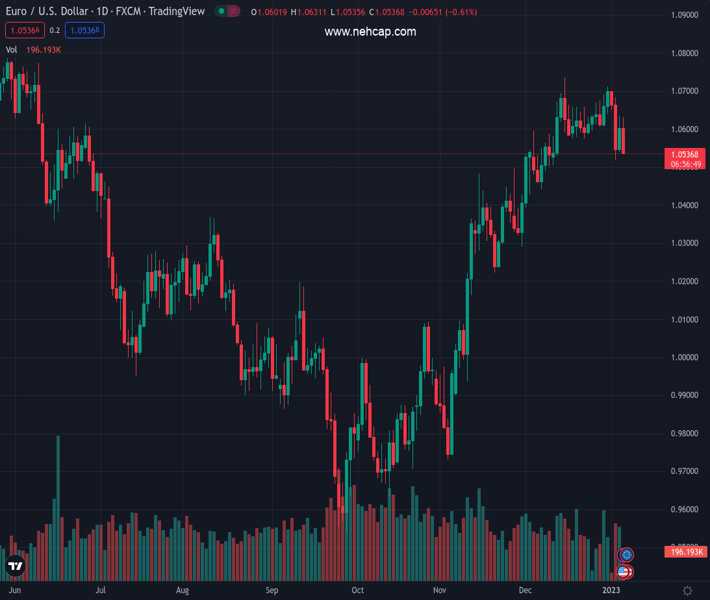
#EURUSD @ 1.05399 ’s upside momentum faltered once again around 1.0630. (Pivot Orderbook analysis)
…
This is a premium post.
[s2If !current_user_can(access_s2member_level4)]Please register for PREMIUM VERSION HERE to read full post below containing analysis. In case of any error or you think you are not able to read the full post below, please email us at support#nehcap.com [lwa][/s2If] [s2If current_user_can(access_s2member_level4)]
- EUR/USD’s upside momentum faltered once again around 1.0630.
- The breakout of that resistance could lead up to a test of 1.0713.
The pair currently trades last at 1.05399.
The previous day high was 1.0636 while the previous day low was 1.0541. The daily 38.2% Fib levels comes at 1.0599, expected to provide resistance. Similarly, the daily 61.8% fib level is at 1.0577, expected to provide resistance.
EUR/USD gives away initial gains and sinks in the red territory well south of the 1.0600 support on Thursday.
Subsequent bullish attempts need to clear the short-term top in the 1.0630/35 band (January 4,5) to allow for a potential visit to the weekly top at 1.0713 (December 30). Once cleared, the pair could then confront the December 2022 peak at 1.0736 (December 15).
The constructive outlook for EUR/USD should remain unchanged while above the key 200-day SMA, today at 1.0314.
Technical Levels: Supports and Resistances
EURUSD currently trading at 1.055 at the time of writing. Pair opened at 1.0603 and is trading with a change of -0.5 % .
| Overview | Overview.1 | |
|---|---|---|
| 0 | Today last price | 1.0550 |
| 1 | Today Daily Change | 89.0000 |
| 2 | Today Daily Change % | -0.5000 |
| 3 | Today daily open | 1.0603 |
The pair is trading below its 20 Daily moving average @ 1.0612, above its 50 Daily moving average @ 1.0385 , above its 100 Daily moving average @ 1.0139 and above its 200 Daily moving average @ 1.0318
| Trends | Trends.1 | |
|---|---|---|
| 0 | Daily SMA20 | 1.0612 |
| 1 | Daily SMA50 | 1.0385 |
| 2 | Daily SMA100 | 1.0139 |
| 3 | Daily SMA200 | 1.0318 |
The previous day high was 1.0636 while the previous day low was 1.0541. The daily 38.2% Fib levels comes at 1.0599, expected to provide resistance. Similarly, the daily 61.8% fib level is at 1.0577, expected to provide resistance.
Note the levels of interest below:
- Pivot support is noted at 1.0551, 1.0499, 1.0456
- Pivot resistance is noted at 1.0646, 1.0688, 1.074
| Levels | Levels.1 |
|---|---|
| Previous Daily High | 1.0636 |
| Previous Daily Low | 1.0541 |
| Previous Weekly High | 1.0713 |
| Previous Weekly Low | 1.0607 |
| Previous Monthly High | 1.0736 |
| Previous Monthly Low | 1.0393 |
| Daily Fibonacci 38.2% | 1.0599 |
| Daily Fibonacci 61.8% | 1.0577 |
| Daily Pivot Point S1 | 1.0551 |
| Daily Pivot Point S2 | 1.0499 |
| Daily Pivot Point S3 | 1.0456 |
| Daily Pivot Point R1 | 1.0646 |
| Daily Pivot Point R2 | 1.0688 |
| Daily Pivot Point R3 | 1.0740 |
[/s2If]
Join Our Telegram Group


