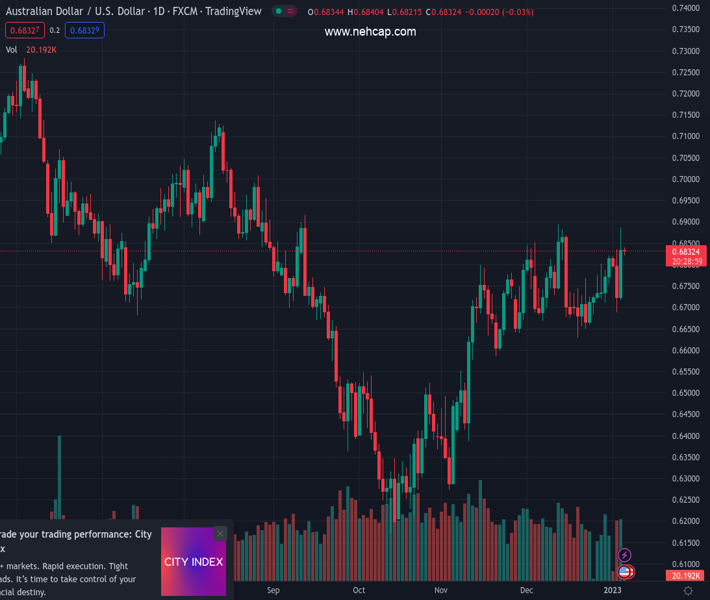
#AUDUSD @ 0.68351 is expected to shift into an inventory accumulation process for a breakout above 0.6900. (Pivot Orderbook analysis)
…
This is a premium post.
[s2If !current_user_can(access_s2member_level4)]Please register for PREMIUM VERSION HERE to read full post below containing analysis. In case of any error or you think you are not able to read the full post below, please email us at support#nehcap.com [lwa][/s2If] [s2If current_user_can(access_s2member_level4)]
- AUD/USD is expected to shift into an inventory accumulation process for a breakout above 0.6900.
- The US Dollar Index has dropped to near 103.70 as the overall risk profile is solid.
- An oscillation in the 40.00-60.00 range by the RSI (14) indicates a consolidation ahead.
The pair currently trades last at 0.68351.
The previous day high was 0.6886 while the previous day low was 0.6717. The daily 38.2% Fib levels comes at 0.6822, expected to provide support. Similarly, the daily 61.8% fib level is at 0.6782, expected to provide support.
The AUD/USD pair has displayed a gradual decline and has slipped to near 0.6820 in the Tokyo session after facing barricades around 0.6890. The Aussie asset has corrected but has not surrendered its upside bias amid an overall risk appetite theme.
Meanwhile, S&P500 futures have sensed some sell-off in Asia after failing to extend its recovery recorded on Wednesday, showing some caution in underpinning the risk-on profile. The US Dollar Index (DXY) has dropped significantly to near 103.70 as investors didn’t find any hawkish cues in the Federal Open Market Committee (FOMC) minutes apart from Federal Reserve (Fed) chair Jerome Powell’s commentary in December’s monetary policy meeting.
AUD/USD has sensed some sell-off while attempting to recapture the horizontal resistance plotted from December 13 high at 0.6893 on a four-hour scale. On a usual basis, inventory accumulation below potential resistances is healthy for a confident breakout. The absence of bearish reversal signs is bolstering the fact of a rangebound action ahead.
Advancing 20-and 50-period Exponential Moving Averages (EMAs) at 0.6805 and 0.6780 respectively add to the upside filters.
The Relative Strength Index (RSI) (14) is oscillating in a 40.00-60.00 range, which indicates the absence of a potential trigger for a decisive move.
For a fresh rally, the Aussie asset needs to deliver a decisive break above December 13 high at 0.6893, which will drive the major towards August 30 high at 0.6956 and the psychological resistance at 0.7000.
On the contrary, a downside move below December 29 low at 0.6710 will drag the major further towards December 22 low at 0.6650 followed by November 21 low at 0.6585.
Technical Levels: Supports and Resistances
AUDUSD currently trading at 0.6834 at the time of writing. Pair opened at 0.6838 and is trading with a change of -0.06 % .
| Overview | Overview.1 | |
|---|---|---|
| 0 | Today last price | 0.6834 |
| 1 | Today Daily Change | -0.0004 |
| 2 | Today Daily Change % | -0.0600 |
| 3 | Today daily open | 0.6838 |
The pair is trading above its 20 Daily moving average @ 0.6751, above its 50 Daily moving average @ 0.6669 , above its 100 Daily moving average @ 0.6636 and below its 200 Daily moving average @ 0.6853
| Trends | Trends.1 | |
|---|---|---|
| 0 | Daily SMA20 | 0.6751 |
| 1 | Daily SMA50 | 0.6669 |
| 2 | Daily SMA100 | 0.6636 |
| 3 | Daily SMA200 | 0.6853 |
The previous day high was 0.6886 while the previous day low was 0.6717. The daily 38.2% Fib levels comes at 0.6822, expected to provide support. Similarly, the daily 61.8% fib level is at 0.6782, expected to provide support.
Note the levels of interest below:
- Pivot support is noted at 0.6741, 0.6644, 0.6571
- Pivot resistance is noted at 0.691, 0.6983, 0.708
| Levels | Levels.1 |
|---|---|
| Previous Daily High | 0.6886 |
| Previous Daily Low | 0.6717 |
| Previous Weekly High | 0.6821 |
| Previous Weekly Low | 0.6710 |
| Previous Monthly High | 0.6893 |
| Previous Monthly Low | 0.6629 |
| Daily Fibonacci 38.2% | 0.6822 |
| Daily Fibonacci 61.8% | 0.6782 |
| Daily Pivot Point S1 | 0.6741 |
| Daily Pivot Point S2 | 0.6644 |
| Daily Pivot Point S3 | 0.6571 |
| Daily Pivot Point R1 | 0.6910 |
| Daily Pivot Point R2 | 0.6983 |
| Daily Pivot Point R3 | 0.7080 |
[/s2If]
Join Our Telegram Group


