WTI edges lower to $74.30 amid the rising oil supply. (Pivot Orderbook analysis)
…
This is a premium post.
[s2If !current_user_can(access_s2member_level4)]Please register for FREE REGISTER to read full post below containing analysis. In case of any error or you think you are not able to read the full post below, please email us at support#nehcap.com [lwa][/s2If] [s2If current_user_can(access_s2member_level1)]
- WTI edges lower to $74.30 amid the rising oil supply.
- US crude oil inventories fell by 6.674M barrels for the week ending January 19 vs. 0.483M barrels gains previously.
- The rising geopolitical tensions in the Red Sea are a primary driver behind lower demand for oil.
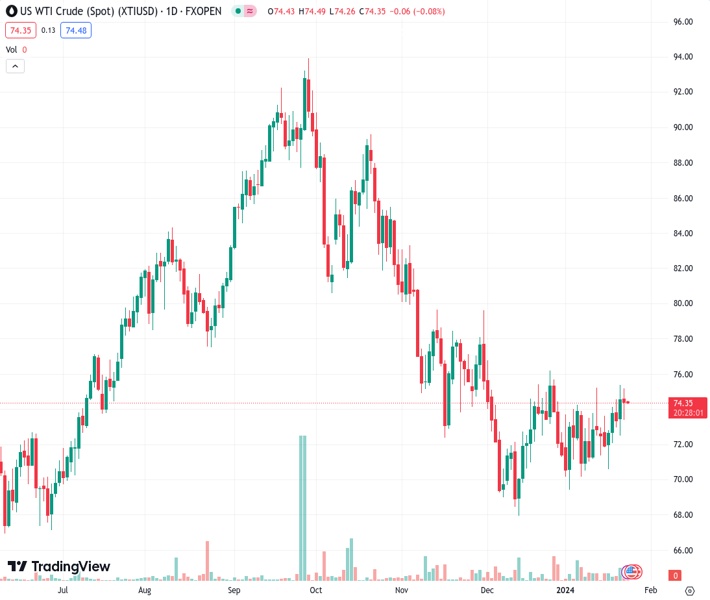
The pair currently trades last at 74.37.
The previous day high was 75.21 while the previous day low was 73.4. The daily 38.2% Fib levels comes at 74.09, expected to provide support. Similarly, the daily 61.8% fib level is at 74.52, expected to provide resistance.
Western Texas Intermediate (WTI), the US crude oil benchmark, is trading around $74.30 on Wednesday. WTI prices drift lower on the day as traders focus on increasing oil output in the US and rising supply in Libya and Norway.
According to the American Petroleum Institute weekly report on Wednesday, US crude oil inventories fell by 6.674M barrels for the week ending January 19 from the previous reading of 0.483M barrels.
Elsewhere, Norway’s crude production rose to 1.85M barrels per day (bpd) in December from 1.81M bpd the previous month, while Libya’s production was at 300,000 bpd. That being said, rising production might exert some pressure on WTI prices.
Apart from this, the sluggish economic recovery in China weighs on WTI prices, as China is the world’s largest oil importer. The weaker-than-expected GDP growth number for the fourth quarter of 2023 dampened oil demand.
On the other hand, the geopolitical tensions in the Red Sea might cap the downside of WTI prices. The Pentagon said on Monday that the US and British forces carried out a new round of strikes in Yemen, targeting a Houthi underground storage site as well as missile and surveillance capabilities used by the Iran-aligned group against Red Sea shipping.
Oil traders will monitor US S&P Global Purchasing Managers Index (PMI) data on Wednesday. The US GDP data for Q4 will be released on Thursday and the Core Personal Consumption Expenditures Price Index (Core PCE) will be due on Friday. These events could significantly impact the USD-denominated WTI price. Oil traders will take cues from the data and find trading opportunities around WTI prices.
Technical Levels: Supports and Resistances
XTIUSD currently trading at 74.37 at the time of writing. Pair opened at 74.5 and is trading with a change of -0.17 % .
| Overview | Overview.1 | |
|---|---|---|
| 0 | Today last price | 74.37 |
| 1 | Today Daily Change | -0.13 |
| 2 | Today Daily Change % | -0.17 |
| 3 | Today daily open | 74.50 |
The pair is trading above its 20 Daily moving average @ 72.63, above its 50 Daily moving average @ 73.41 , below its 100 Daily moving average @ 79.3 and below its 200 Daily moving average @ 77.27
| Trends | Trends.1 | |
|---|---|---|
| 0 | Daily SMA20 | 72.63 |
| 1 | Daily SMA50 | 73.41 |
| 2 | Daily SMA100 | 79.30 |
| 3 | Daily SMA200 | 77.27 |
The previous day high was 75.21 while the previous day low was 73.4. The daily 38.2% Fib levels comes at 74.09, expected to provide support. Similarly, the daily 61.8% fib level is at 74.52, expected to provide resistance.
Note the levels of interest below:
- Pivot support is noted at 73.53, 72.56, 71.72
- Pivot resistance is noted at 75.34, 76.18, 77.16
| Levels | Levels.1 |
|---|---|
| Previous Daily High | 75.21 |
| Previous Daily Low | 73.40 |
| Previous Weekly High | 74.60 |
| Previous Weekly Low | 70.63 |
| Previous Monthly High | 76.79 |
| Previous Monthly Low | 67.97 |
| Daily Fibonacci 38.2% | 74.09 |
| Daily Fibonacci 61.8% | 74.52 |
| Daily Pivot Point S1 | 73.53 |
| Daily Pivot Point S2 | 72.56 |
| Daily Pivot Point S3 | 71.72 |
| Daily Pivot Point R1 | 75.34 |
| Daily Pivot Point R2 | 76.18 |
| Daily Pivot Point R3 | 77.16 |
[/s2If]
Nehcap Trading Strategies
The NEHCAP currently runs the following trading systems for clients. They can be bought and run on your funds.
The system is trading live: LIVE ACCOUNT TRACKING
Contact Us: Contact
The HFT_FIX can be run free for 2 weeks on any broker with a ECN. Apply for a free trial
Join Our Telegram Group


