WTI Oil prices remain under some selling pressure for the second straight day on Monday. (Pivot Orderbook analysis)
…
This is a premium post.
[s2If !current_user_can(access_s2member_level4)]Please register for FREE REGISTER to read full post below containing analysis. In case of any error or you think you are not able to read the full post below, please email us at support#nehcap.com [lwa][/s2If] [s2If current_user_can(access_s2member_level1)]
- WTI Oil prices remain under some selling pressure for the second straight day on Monday.
- Concerns over a near-term slowdown in demand continue to undermine the black liquid.
- Fears of supply disruptions in the Middle East could lend support and limit deeper losses.
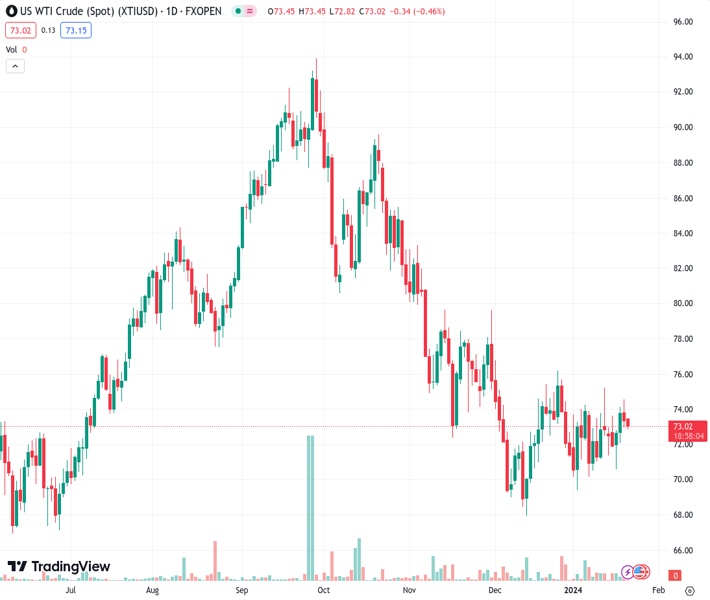
The pair currently trades last at 72.96.
The previous day high was 74.6 while the previous day low was 72.98. The daily 38.2% Fib levels comes at 73.6, expected to provide resistance. Similarly, the daily 61.8% fib level is at 73.99, expected to provide resistance.
West Texas Intermediate (WTI) US Crude Oil prices drift lower for the second successive day on Monday and trade around the $73.00/barrel mark during the Asian session. The commodity, however, remains confined in a familiar trading range held over the past three weeks or so amid mixed fundamental cues, warranting caution before placing aggressive directional bets.
Extreme cold weather in the US has limited travel in large parts of the country and raised concerns about a slowdown in demand from the world’s largest fuel consumer. Furthermore, a sluggish economic recovery in China – the world’s largest Oil importer – turns out to be another factor undermining the black liquid. Meanwhile, Oil markets are expected to remain well supplied in the first half of 2024, amid underwhelming production cuts from OPEC and record-high US output, and support prospects for additional near-term losses.
Investors, meanwhile, remain worried that the Israel-Hamas war could spill over into other parts of the region and disrupt Oil supply from the Middle East. This, along with the expected improvement in the global Oil demand over the next two years, is holding back bearish traders from positioning for deeper losses. In fact, both the OPEC and the International Energy Agency (IEA) last week raised the global Oil demand forecast for 2024. Apart from this, an attack on a Russian fuel export terminal over the weekend should limit losses for Oil prices.
Traders now await this week’s key central bank meetings and economic readings for a fresh impetus. The Bank of Japan (BoJ) is set to announce its policy decision on Tuesday and the European Central Bank (ECB) will meet on Thursday. Apart from this, the release of the flash global PMI prints for January, along with the fourth-quarter US GDP print, will be watched for cues about fuel demand and infuse some volatility around Oil prices.
Technical Levels: Supports and Resistances
XTIUSD currently trading at 72.96 at the time of writing. Pair opened at 73.6 and is trading with a change of -0.87 % .
| Overview | Overview.1 | |
|---|---|---|
| 0 | Today last price | 72.96 |
| 1 | Today Daily Change | -0.64 |
| 2 | Today Daily Change % | -0.87 |
| 3 | Today daily open | 73.60 |
The pair is trading above its 20 Daily moving average @ 72.62, below its 50 Daily moving average @ 73.56 , below its 100 Daily moving average @ 79.53 and below its 200 Daily moving average @ 77.34
| Trends | Trends.1 | |
|---|---|---|
| 0 | Daily SMA20 | 72.62 |
| 1 | Daily SMA50 | 73.56 |
| 2 | Daily SMA100 | 79.53 |
| 3 | Daily SMA200 | 77.34 |
The previous day high was 74.6 while the previous day low was 72.98. The daily 38.2% Fib levels comes at 73.6, expected to provide resistance. Similarly, the daily 61.8% fib level is at 73.99, expected to provide resistance.
Note the levels of interest below:
- Pivot support is noted at 72.85, 72.11, 71.23
- Pivot resistance is noted at 74.47, 75.35, 76.09
| Levels | Levels.1 |
|---|---|
| Previous Daily High | 74.60 |
| Previous Daily Low | 72.98 |
| Previous Weekly High | 74.60 |
| Previous Weekly Low | 70.63 |
| Previous Monthly High | 76.79 |
| Previous Monthly Low | 67.97 |
| Daily Fibonacci 38.2% | 73.60 |
| Daily Fibonacci 61.8% | 73.99 |
| Daily Pivot Point S1 | 72.85 |
| Daily Pivot Point S2 | 72.11 |
| Daily Pivot Point S3 | 71.23 |
| Daily Pivot Point R1 | 74.47 |
| Daily Pivot Point R2 | 75.35 |
| Daily Pivot Point R3 | 76.09 |
[/s2If]
Nehcap Trading Strategies
The NEHCAP currently runs the following trading systems for clients. They can be bought and run on your funds.
The system is trading live: LIVE ACCOUNT TRACKING
Contact Us: Contact
The HFT_FIX can be run free for 2 weeks on any broker with a ECN. Apply for a free trial
Join Our Telegram Group


