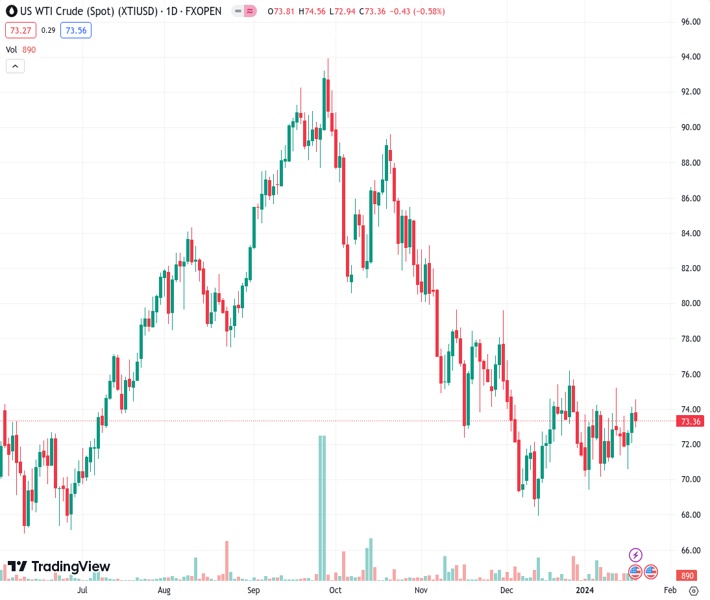
Crude Oil markets pushed into a new high for the week before settling back on Friday. (Pivot Orderbook analysis)
…
This is a premium post.
[s2If !current_user_can(access_s2member_level4)]Please register for FREE REGISTER to read full post below containing analysis. In case of any error or you think you are not able to read the full post below, please email us at support#nehcap.com [lwa][/s2If] [s2If current_user_can(access_s2member_level1)]
- Crude Oil markets pushed into a new high for the week before settling back on Friday.
- WTI roils between $74.50 and $73.00 on Friday.
- Freezing temperatures and geopolitical tensions weigh on supply concerns.
The pair currently trades last at 73.6.
The previous day high was 74.18 while the previous day low was 72.12. The daily 38.2% Fib levels comes at 73.39, expected to provide support. Similarly, the daily 61.8% fib level is at 72.91, expected to provide support.
Crude Oil bids broadly rose over the week in jittery trading that saw frequent peaks and dips into highs and lows, with West Texas Intermediate (WTI) US Crude Oil settling the week near $73.60 with a 5.6% or $3 spread between the week’s late peak set late on Friday at $74.60 and Wednesday’s weekly low at $70.62.
Broad-market concerns about production caps from the Organization of the Petroleum Exporting Countries (OPEC) that plagued energy markets for much of the third quarter of 2023 have all but evaporated, being replaced by broad-market concerns that Iran-backed Houthi rebels attacking civilian ships in the Red Sea will hamper critical global supply lines between Europe and Asia.
Bullish Crude Oil prices on supply concerns have seen significant downside pressure crimp topside momentum, with the US hitting record levels of Crude Oil production in 2023 and on pace to continue ramping up barrel output looking forward.
Canada is also set to hit new production highs as Crude Oil producers in Alberta ramp up production as the Trans Mountain pipeline nears completion, which will make it easier for the oil-exporting country to add their raw light sweet crude oil supplies to the US’ logistics chain. As the fourth-largest global producer of Crude Oil, Canada stands poised to launch the US even further to the top of the leaderboard as a global net producer and exporter of downstream oil products.
Despite a historic overhang in partially-refined Crude Oil products, declines in near-term raw barrel supplies is drawing a line underneath barrel prices as energy markets await a more solidified outlook on global supply balances in Crude Oil.
Choppy trading as markets get pulled in both directions leave Crude Oil traders strung along the midrange, with WTI testing familiar territory near the $74.00 handle. WTI has cycled the key price handle in a tightening pattern since descending into the neighborhood in early November, and a sideways grind in the WTI chart has the 50-day Simple Moving Average (SMA) descending into intraday territory.
The 200-day SMA is accelerating a downturn from the $78.00 handle, which will add bearish pressure to near-term price action to the low side if bulls can’t push WTI back over medium-term technical resistance at the $76.00 handle.
Technical Levels: Supports and Resistances
XTIUSD currently trading at 73.6 at the time of writing. Pair opened at 73.89 and is trading with a change of -0.39 % .
| Overview | Overview.1 | |
|---|---|---|
| 0 | Today last price | 73.60 |
| 1 | Today Daily Change | -0.29 |
| 2 | Today Daily Change % | -0.39 |
| 3 | Today daily open | 73.89 |
The pair is trading above its 20 Daily moving average @ 72.62, below its 50 Daily moving average @ 73.63 , below its 100 Daily moving average @ 79.65 and below its 200 Daily moving average @ 77.38
| Trends | Trends.1 | |
|---|---|---|
| 0 | Daily SMA20 | 72.62 |
| 1 | Daily SMA50 | 73.63 |
| 2 | Daily SMA100 | 79.65 |
| 3 | Daily SMA200 | 77.38 |
The previous day high was 74.18 while the previous day low was 72.12. The daily 38.2% Fib levels comes at 73.39, expected to provide support. Similarly, the daily 61.8% fib level is at 72.91, expected to provide support.
Note the levels of interest below:
- Pivot support is noted at 72.61, 71.33, 70.54
- Pivot resistance is noted at 74.67, 75.46, 76.74
| Levels | Levels.1 |
|---|---|
| Previous Daily High | 74.18 |
| Previous Daily Low | 72.12 |
| Previous Weekly High | 75.28 |
| Previous Weekly Low | 70.21 |
| Previous Monthly High | 76.79 |
| Previous Monthly Low | 67.97 |
| Daily Fibonacci 38.2% | 73.39 |
| Daily Fibonacci 61.8% | 72.91 |
| Daily Pivot Point S1 | 72.61 |
| Daily Pivot Point S2 | 71.33 |
| Daily Pivot Point S3 | 70.54 |
| Daily Pivot Point R1 | 74.67 |
| Daily Pivot Point R2 | 75.46 |
| Daily Pivot Point R3 | 76.74 |
[/s2If]
Nehcap Trading Strategies
The NEHCAP currently runs the following trading systems for clients. They can be bought and run on your funds.
The system is trading live: LIVE ACCOUNT TRACKING
Contact Us: Contact
The HFT_FIX can be run free for 2 weeks on any broker with a ECN. Apply for a free trial
Join Our Telegram Group


