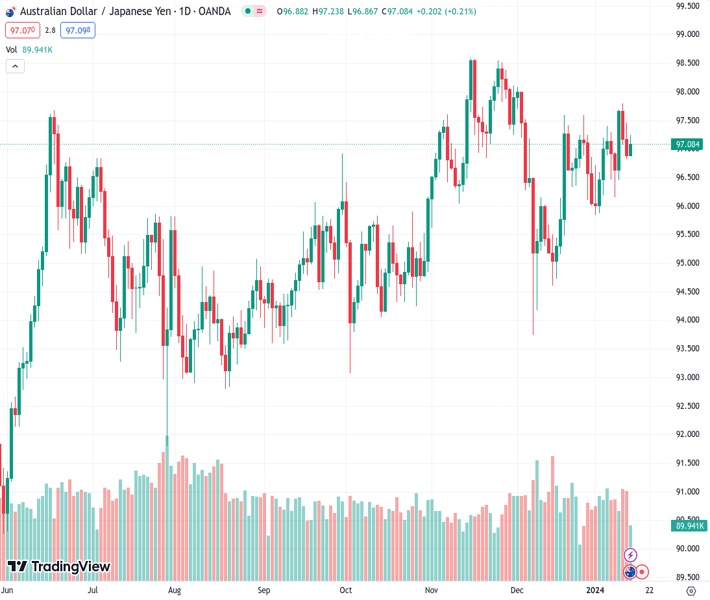
#AUDJPY @ 97.0680 ‘s gains defy typical risk aversion impact, supported by fading expectations of BoJ policy normalization. (Pivot Orderbook analysis)
…
This is a premium post.
[s2If !current_user_can(access_s2member_level4)]Please register for FREE REGISTER to read full post below containing analysis. In case of any error or you think you are not able to read the full post below, please email us at support#nehcap.com [lwa][/s2If] [s2If current_user_can(access_s2member_level1)]
- AUD/JPY’s gains defy typical risk aversion impact, supported by fading expectations of BoJ policy normalization.
- Technical indicators signal bullish trend; immediate targets include 97.79, 98.00, and November 30 high at 98.10.
- Downside risks for AUD/JPY include potential supports at 96.41 (Senkou Span A), 96.14 (Senkou Span B), and the 96.00 level.
The pair currently trades last at 97.0680.
The previous day high was 97.45 while the previous day low was 96.84. The daily 38.2% Fib levels comes at 97.07, expected to provide resistance. Similarly, the daily 61.8% fib level is at 97.22, expected to provide resistance.
The Aussie Dollar (AUD) prints gains versus the Japanese Yen (JPY) on Monday amid a risk aversion environment, which usually is a headwind for the AUD/JPY pair. Nevertheless, Japanese data revealed during January has brushed away the chances for the Bank of Japan (BoJ) to normalize policy, meaning higher interest rates. Therefore, the AUD/JPY trades at 97.08, gains 0.27%.
From a technical perspective, the AUD/JPY turned bullish as the Chikou Span has broken above price action in the daily chart. That, alongside the exchange rate seen above, the Ichimoku Cloud (Kumo), has opened the door for further gains, though traders must regain key resistance levels on their way north.
The first supply zone would be the January 11 high of 97.79, followed by the 98.00 figure, and the November 30 mark 1t 98.10. Further upside is at 98.58, the November 15 high.
On the other hand, if sellers would like to drag prices below 97.00. Once cleared, the next support would be the Senkou Span A at 96.41, followed by the Senkow Span B at 96.14, followed by the 96.00 figure.
Technical Levels: Supports and Resistances
AUDJPY currently trading at 97.1 at the time of writing. Pair opened at 96.84 and is trading with a change of 0.27 % .
| Overview | Overview.1 | |
|---|---|---|
| 0 | Today last price | 97.10 |
| 1 | Today Daily Change | 0.26 |
| 2 | Today Daily Change % | 0.27 |
| 3 | Today daily open | 96.84 |
The pair remains strongly bullish on the daily timeframe. It trades above its 20 SMA @ 96.74, 50 SMA 96.86, 100 SMA @ 95.94 and 200 SMA @ 94.51.
| Trends | Trends.1 | |
|---|---|---|
| 0 | Daily SMA20 | 96.74 |
| 1 | Daily SMA50 | 96.86 |
| 2 | Daily SMA100 | 95.94 |
| 3 | Daily SMA200 | 94.51 |
The previous day high was 97.45 while the previous day low was 96.84. The daily 38.2% Fib levels comes at 97.07, expected to provide resistance. Similarly, the daily 61.8% fib level is at 97.22, expected to provide resistance.
Note the levels of interest below:
- Pivot support is noted at 96.64, 96.43, 96.02
- Pivot resistance is noted at 97.25, 97.66, 97.86
| Levels | Levels.1 |
|---|---|
| Previous Daily High | 97.45 |
| Previous Daily Low | 96.84 |
| Previous Weekly High | 97.80 |
| Previous Weekly Low | 96.15 |
| Previous Monthly High | 98.07 |
| Previous Monthly Low | 93.73 |
| Daily Fibonacci 38.2% | 97.07 |
| Daily Fibonacci 61.8% | 97.22 |
| Daily Pivot Point S1 | 96.64 |
| Daily Pivot Point S2 | 96.43 |
| Daily Pivot Point S3 | 96.02 |
| Daily Pivot Point R1 | 97.25 |
| Daily Pivot Point R2 | 97.66 |
| Daily Pivot Point R3 | 97.86 |
[/s2If]
Nehcap Trading Strategies
The NEHCAP currently runs the following trading systems for clients. They can be bought and run on your funds.
The system is trading live: LIVE ACCOUNT TRACKING
Contact Us: Contact
The HFT_FIX can be run free for 2 weeks on any broker with a ECN. Apply for a free trial
Join Our Telegram Group
")


