#GBPJPY @ 185.546 gathers steam as ‘bullish piercing pattern’ emerges, with buyers targeting 186.00 and beyond. (Pivot Orderbook analysis)
…
This is a premium post.
[s2If !current_user_can(access_s2member_level4)]Please register for FREE REGISTER to read full post below containing analysis. In case of any error or you think you are not able to read the full post below, please email us at support#nehcap.com [lwa][/s2If] [s2If current_user_can(access_s2member_level1)]
- GBP/JPY gathers steam as ‘bullish piercing pattern’ emerges, with buyers targeting 186.00 and beyond.
- The cross shifted bullish as buyers light exchange rate above the Kumo, with upside risks at 186.10, and 187.56.
- Potential downside risks lie at 184.47, followed by 183.49.
The pair currently trades last at 185.546.
The previous day high was 185.67 while the previous day low was 184.48. The daily 38.2% Fib levels comes at 184.93, expected to provide support. Similarly, the daily 61.8% fib level is at 185.22, expected to provide support.
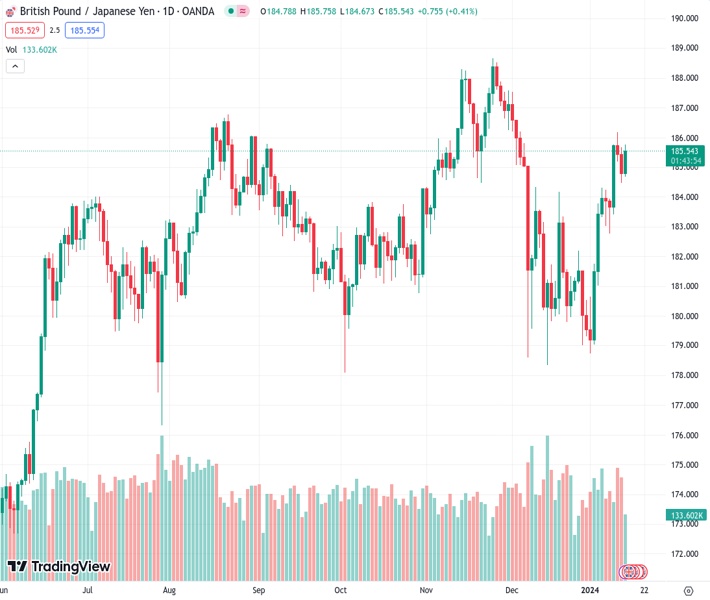
The GBP/JPY is up by 0.47% on Monday, though it remains reluctant to push above the 186.00 figure for the fourth straight day despite turning bullish. At the time of writing, the cross-currency pair is trading at 185.54 after hitting a daily low of 184.62.
The daily chart portrays the pair as having pierced above the Ichimoku Cloud (Kumo), opening the door for further gains. Besides that, the Chiou Span is about to cross above price action, which would be the second bullish signal, that could propel the GBP/JPY toward higher prices.
If buyers surpass the January 11 high at 186.10, that would pave the way for further upside. Once cleared, the next stop would be the November 30 swing high at 187.56, followed by the November 24 high at 188.66.
On the flip side, if GBP/JPY slides below the January 12 daily low of 184.47, that could put the uptrend in danger. If the cross hurdles that level, the next support would be the Senkou Span B at 183.49, followed by the Tenkan-Sen at 182.55, followed by the Senlo Span A at 182.39, and the Kijun-Sen at 182.25.
Technical Levels: Supports and Resistances
GBPJPY currently trading at 185.55 at the time of writing. Pair opened at 184.67 and is trading with a change of 0.48 % .
| Overview | Overview.1 | |
|---|---|---|
| 0 | Today last price | 185.55 |
| 1 | Today Daily Change | 0.88 |
| 2 | Today Daily Change % | 0.48 |
| 3 | Today daily open | 184.67 |
The pair remains strongly bullish on the daily timeframe. It trades above its 20 SMA @ 182.05, 50 SMA 184.0, 100 SMA @ 183.44 and 200 SMA @ 180.14.
| Trends | Trends.1 | |
|---|---|---|
| 0 | Daily SMA20 | 182.05 |
| 1 | Daily SMA50 | 184.00 |
| 2 | Daily SMA100 | 183.44 |
| 3 | Daily SMA200 | 180.14 |
The previous day high was 185.67 while the previous day low was 184.48. The daily 38.2% Fib levels comes at 184.93, expected to provide support. Similarly, the daily 61.8% fib level is at 185.22, expected to provide support.
Note the levels of interest below:
- Pivot support is noted at 184.21, 183.75, 183.02
- Pivot resistance is noted at 185.4, 186.13, 186.59
| Levels | Levels.1 |
|---|---|
| Previous Daily High | 185.67 |
| Previous Daily Low | 184.48 |
| Previous Weekly High | 186.17 |
| Previous Weekly Low | 182.76 |
| Previous Monthly High | 187.52 |
| Previous Monthly Low | 178.35 |
| Daily Fibonacci 38.2% | 184.93 |
| Daily Fibonacci 61.8% | 185.22 |
| Daily Pivot Point S1 | 184.21 |
| Daily Pivot Point S2 | 183.75 |
| Daily Pivot Point S3 | 183.02 |
| Daily Pivot Point R1 | 185.40 |
| Daily Pivot Point R2 | 186.13 |
| Daily Pivot Point R3 | 186.59 |
[/s2If]
Nehcap Trading Strategies
The NEHCAP currently runs the following trading systems for clients. They can be bought and run on your funds.
The system is trading live: LIVE ACCOUNT TRACKING
Contact Us: Contact
The HFT_FIX can be run free for 2 weeks on any broker with a ECN. Apply for a free trial
Join Our Telegram Group
")


