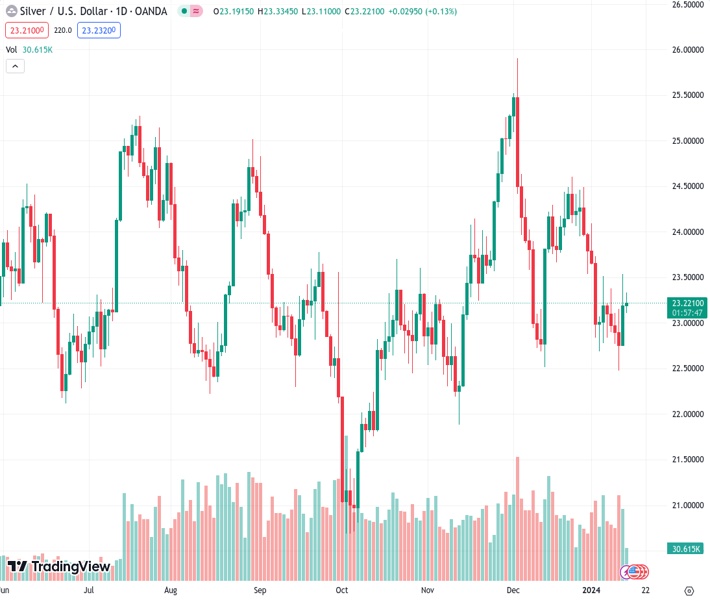
#XAGUSD @ 23.204 The rose near the $23.20 level, challenging the 100-day SMA. (Pivot Orderbook analysis)
…
This is a premium post.
[s2If !current_user_can(access_s2member_level4)]Please register for FREE REGISTER to read full post below containing analysis. In case of any error or you think you are not able to read the full post below, please email us at support#nehcap.com [lwa][/s2If] [s2If current_user_can(access_s2member_level1)]
- The XAG/USD rose near the $23.20 level, challenging the 100-day SMA.
- Despite hot CPI data, the market maintains high dovish bets on the Federal Reserve.
- The 2-year bond yield hit fresh lows since May.
The pair currently trades last at 23.204.
The previous day high was 23.53 while the previous day low was 22.74. The daily 38.2% Fib levels comes at 23.23, expected to provide resistance. Similarly, the daily 61.8% fib level is at 23.04, expected to provide support.
Starting the week, the Silver (XAG/USD) is seeing an uplift, trading around the $23.20 mark. The upward move is primarily driven by decreased US Yields and dovish expectations regarding the Federal Reserve (Fed), which have helped steer the metal upward.
Currently, data from the CME FedWatch Tool displays a high chance of interest rate reductions in March and May, calculated at 70% and 66%, respectively. It’s worth noticing that the market’s dovish bets may be exaggerated as inflation in the US slightly picked up in December, and the US economy remains overheated, which may present a threat to the Fed in its battle against inflation. Investors may be discounting that the bank won’t risk an economic downturn in a year with elections.
Presently, US Treasury yields are sharply down. The 2-year rate is trading at 4.14%, whereas the 5-year and 10-year rates are observed at 3.83% and 3.96%, respectively. This pushes the price of the non-yielding metal up as the opportunity cost of holding them decreases.
On Wednesday, the US will release Retail Sales Figures from December and the Fed the Beige Book, which may affect the metal’s price dynamics..
The daily chart suggests that the metal has a bearish outlook in the short term despite the upward movements. From a technical perspective, the Relative Strength Index (RSI) is flat, indicating a lack of momentum in either direction. However, its position in the negative territory suggests that sellers have been more active recently.
The Moving Average Convergence Divergence (MACD), evidenced by flat red bars, signals a bearish bias. While the MACD itself is flat, indicating no strong momentum, the color of the histogram’s bars reinforces the presence of sellers in the market.
The Simple Moving Averages (SMAs) further supplement the bearish narrative. The metal’s price is trading below the 20, 100, and 200-day SMAs, a prevailing indication that bears are in control of the bigger picture.
Technical Levels: Supports and Resistances
XAGUSD currently trading at 23.21 at the time of writing. Pair opened at 23.16 and is trading with a change of 0.22 % .
| Overview | Overview.1 | |
|---|---|---|
| 0 | Today last price | 23.21 |
| 1 | Today Daily Change | 0.05 |
| 2 | Today Daily Change % | 0.22 |
| 3 | Today daily open | 23.16 |
The pair remains strongly bearish on the daily time frame. It trades below the 20 SMA @ 23.63, 50 SMA 23.66, 100 SMA @ 23.27 and 200 SMA @ 23.62.
| Trends | Trends.1 | |
|---|---|---|
| 0 | Daily SMA20 | 23.63 |
| 1 | Daily SMA50 | 23.66 |
| 2 | Daily SMA100 | 23.27 |
| 3 | Daily SMA200 | 23.62 |
The previous day high was 23.53 while the previous day low was 22.74. The daily 38.2% Fib levels comes at 23.23, expected to provide resistance. Similarly, the daily 61.8% fib level is at 23.04, expected to provide support.
Note the levels of interest below:
- Pivot support is noted at 22.75, 22.35, 21.96
- Pivot resistance is noted at 23.55, 23.94, 24.34
| Levels | Levels.1 |
|---|---|
| Previous Daily High | 23.53 |
| Previous Daily Low | 22.74 |
| Previous Weekly High | 23.53 |
| Previous Weekly Low | 22.48 |
| Previous Monthly High | 25.92 |
| Previous Monthly Low | 22.51 |
| Daily Fibonacci 38.2% | 23.23 |
| Daily Fibonacci 61.8% | 23.04 |
| Daily Pivot Point S1 | 22.75 |
| Daily Pivot Point S2 | 22.35 |
| Daily Pivot Point S3 | 21.96 |
| Daily Pivot Point R1 | 23.55 |
| Daily Pivot Point R2 | 23.94 |
| Daily Pivot Point R3 | 24.34 |
[/s2If]
Nehcap Trading Strategies
The NEHCAP currently runs the following trading systems for clients. They can be bought and run on your funds.
The system is trading live: LIVE ACCOUNT TRACKING
Contact Us: Contact
The HFT_FIX can be run free for 2 weeks on any broker with a ECN. Apply for a free trial
Join Our Telegram Group
")


