The US Dollar trades in a range despite rising tensions in the Middle East and Asia.
…
This is a premium post.
[s2If !current_user_can(access_s2member_level4)]Please register for FREE REGISTER to read full post below containing analysis. In case of any error or you think you are not able to read the full post below, please email us at support#nehcap.com [lwa][/s2If] [s2If current_user_can(access_s2member_level1)]
- The US Dollar trades in a range despite rising tensions in the Middle East and Asia.
- Traders are gearing up for US Retail Sales and Michigan Consumer Sentiment numbers this week.
- The US Dollar Index in the mid-102 area while world leaders convene in Davos for the World Economic Forum.
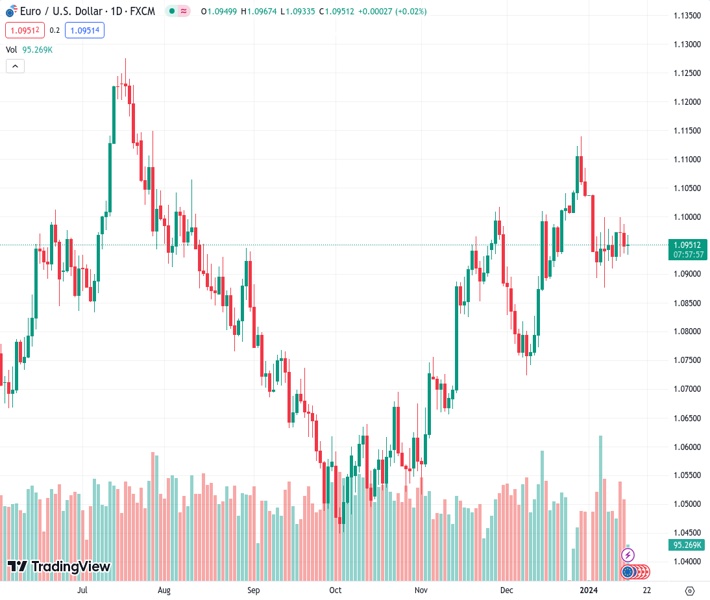
The US Dollar (USD) is still stuck in a range while markets are puzzling to see where to go next. Several moving parts are in the mix with US economic data starting to show a very mixed picture with several data points in contraction while the labour market remains very tight. Add to that the World Economic Forum taking place in Davos, while at the same time Israel, Gaza, Red Sea, Yemen, Ukraine and Russia remain the hot topics smouldering in the background.
On the economic data front focal points this week will be Wednesday and Friday, while traders enjoy a day off on Monday. With Martin Luther King Day, the US trading session will be moving on very low volumes. Wednesday traders will gear up for US retail sales and on Friday the University of Michigan will tell markets more on the Consumer Sentiment.
The US Dollar Index (DXY) is starting to develop a pattern for 2024, and it looks to be completely different from 2023. The economic data points are not moving the needle anymore like they did in 2023, with rather macroeconomic news to drive the DXY either up or down. The overnight outcome of the Iowa Primary, which counts as a litmus test for the Presidential Elections in November, could send the DXY off in a direction that will build up all the way back to November levels.
The first level on the upside to watch is 102.70, which falls nearly in line with the trend line from the top of October 3 and December 8. If broken and closed above, the 200-day Simple Moving Average (SMA) at 103.44 comes into play. The 104.00 level might be too far off, with 103.56 (55-day SMA) coming in as the next resistance.
A rejection by the descending trendline will give fuel to Greenback bears leading to a further downturn. The line in the sand here is 101.74 – the floor which held halfway through December before breaking down in the last two weeks. In case the DXY snaps this level, expect to see a test at the low near 100.80.
[/s2If]
Nehcap Trading Strategies
The NEHCAP currently runs the following trading systems for clients. They can be bought and run on your funds.
The system is trading live: LIVE ACCOUNT TRACKING
Contact Us: Contact
The HFT_FIX can be run free for 2 weeks on any broker with a ECN. Apply for a free trial
Join Our Telegram Group


