#USDCHF @ 0.85438 The edges up on risk aversion but remains trapped within previous ranges. (Pivot Orderbook analysis)
…
This is a premium post.
[s2If !current_user_can(access_s2member_level4)]Please register for FREE REGISTER to read full post below containing analysis. In case of any error or you think you are not able to read the full post below, please email us at support#nehcap.com [lwa][/s2If] [s2If current_user_can(access_s2member_level1)]
- The edges up on risk aversion but remains trapped within previous ranges.
- Trading is light with US markets closed on bank holidays.
- USD/CHF is on a corrective recovery, aiming for 0.8575 and 0.8665.
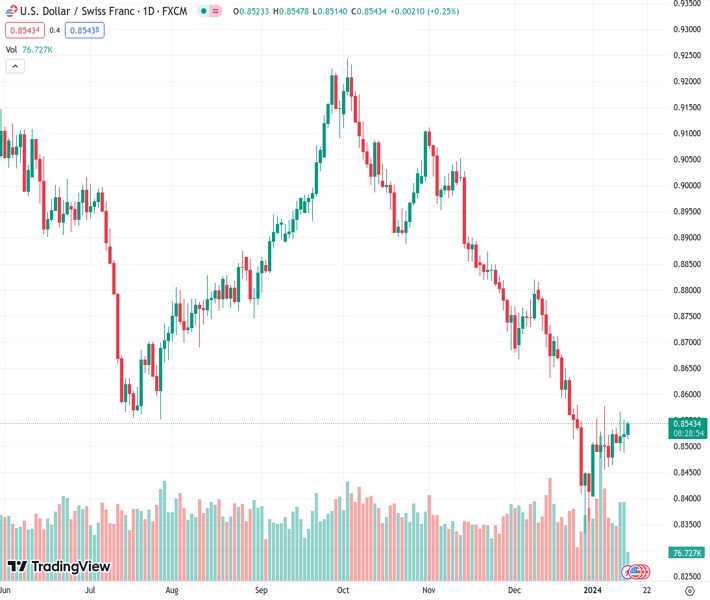
The pair currently trades last at 0.85438.
The previous day high was 0.8551 while the previous day low was 0.8489. The daily 38.2% Fib levels comes at 0.8512, expected to provide support. Similarly, the daily 61.8% fib level is at 0.8527, expected to provide support.
The US Dollar is going through a moderate recovery against the Swiss Franc on Monday. The Dollar Index is trimming some losses, favoured by the sourer market sentiment although it remains trapped within previous ranges.
The USD Index remains capped below the 102.75 resistance area, which is coincident with the USD/CHF’s 0.8575 level. The weaker market sentiment is providing some support to the safe-haven USD yet, trading volume is light with US markets closed on bank holidays.
The economic docket is thin today. In the US, the New York Fed Empire State Manufacturing Index might provide some guidance for traders, although the highlights will be Wednesday’s Retail Sales and Friday’s Michigan Consumer Sentiment Index.
The pair is now in a corrective recovery after having depreciated nearly 10% in the last quarter of 2023. Immediate resistance is the mentioned 0.8575 and above here, the 38.2% Fibonacci retracement of the mentioned decline, at 0.8665.
Supports are 0.8460 and December’s low at 0.8325.
Technical Levels: Supports and Resistances
USDCHF currently trading at 0.8544 at the time of writing. Pair opened at 0.8522 and is trading with a change of 0.26 % .
| Overview | Overview.1 | |
|---|---|---|
| 0 | Today last price | 0.8544 |
| 1 | Today Daily Change | 0.0022 |
| 2 | Today Daily Change % | 0.2600 |
| 3 | Today daily open | 0.8522 |
The pair is trading above its 20 Daily moving average @ 0.8519, below its 50 Daily moving average @ 0.8707 , below its 100 Daily moving average @ 0.8854 and below its 200 Daily moving average @ 0.8872
| Trends | Trends.1 | |
|---|---|---|
| 0 | Daily SMA20 | 0.8519 |
| 1 | Daily SMA50 | 0.8707 |
| 2 | Daily SMA100 | 0.8854 |
| 3 | Daily SMA200 | 0.8872 |
The previous day high was 0.8551 while the previous day low was 0.8489. The daily 38.2% Fib levels comes at 0.8512, expected to provide support. Similarly, the daily 61.8% fib level is at 0.8527, expected to provide support.
Note the levels of interest below:
- Pivot support is noted at 0.849, 0.8458, 0.8428
- Pivot resistance is noted at 0.8552, 0.8583, 0.8615
| Levels | Levels.1 |
|---|---|
| Previous Daily High | 0.8551 |
| Previous Daily Low | 0.8489 |
| Previous Weekly High | 0.8566 |
| Previous Weekly Low | 0.8460 |
| Previous Monthly High | 0.8821 |
| Previous Monthly Low | 0.8333 |
| Daily Fibonacci 38.2% | 0.8512 |
| Daily Fibonacci 61.8% | 0.8527 |
| Daily Pivot Point S1 | 0.8490 |
| Daily Pivot Point S2 | 0.8458 |
| Daily Pivot Point S3 | 0.8428 |
| Daily Pivot Point R1 | 0.8552 |
| Daily Pivot Point R2 | 0.8583 |
| Daily Pivot Point R3 | 0.8615 |
[/s2If]
Nehcap Trading Strategies
The NEHCAP currently runs the following trading systems for clients. They can be bought and run on your funds.
The system is trading live: LIVE ACCOUNT TRACKING
Contact Us: Contact
The HFT_FIX can be run free for 2 weeks on any broker with a ECN. Apply for a free trial
Join Our Telegram Group


