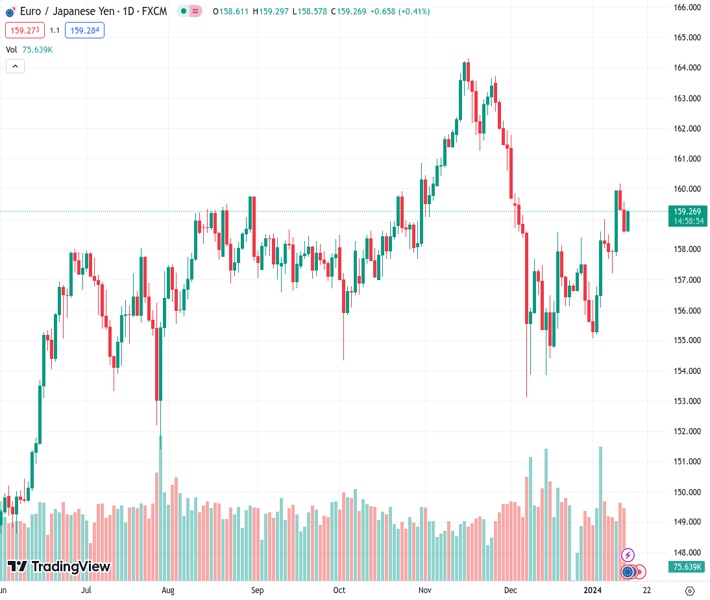
#EURJPY @ 159.270 rebounds to 159.25 ahead of the Eurozone Industrial Production data. (Pivot Orderbook analysis)
…
This is a premium post.
[s2If !current_user_can(access_s2member_level4)]Please register for FREE REGISTER to read full post below containing analysis. In case of any error or you think you are not able to read the full post below, please email us at support#nehcap.com [lwa][/s2If] [s2If current_user_can(access_s2member_level1)]
- EUR/JPY rebounds to 159.25 ahead of the Eurozone Industrial Production data.
- The cross keeps the bullish vibe unchanged above the key EMA; RSI indicator stands above the 50 midline.
- The critical upside barrier is seen at 160.00; the key support level is located at the 158.30–158.40 zone.
The pair currently trades last at 159.270.
The previous day high was 159.8 while the previous day low was 158.54. The daily 38.2% Fib levels comes at 159.02, expected to provide support. Similarly, the daily 61.8% fib level is at 159.32, expected to provide resistance.
The EUR/JPY cross snaps the two-day losing streak during the early European session on Monday. The European Central Bank (ECB) chief economist Philip Lane said on Saturday that the central bank will have important data by June to decide on a likely series of interest rate cuts, but moving prematurely may prove self-defeating. Investors anticipate that the ECB may cut interest rates sooner than anticipated. At the press time, EUR/JPY is trading at 159.25, gaining 0.36% on the day.
According to the four-hour chart, the bullish outlook of EUR/JPY remains intact as the cross holds above the 50- and 100-hour Exponential Moving Averages (EMA). The positive bias is backed by the 14-day Relative Strength Index (RSI) which stands above the 50 midline, indicating the further upside looks favorable.
The critical upside barrier is seen near a high of January 10, and the psychological round mark at 160.00. A break above the latter will see a rally to the upper boundary of Bollinger Band at 160.15. Any follow-through buying will pave the way to a high of December 1 at 161.77.
On the flip side, the key support level to watch is the confluence of the lower limit of the Bollinger Band and the 50-hour EMA at the 158.30–158.40 region. Further south, the next contention level is located at the 100-EMA at 157.95. A breach of this level will see a drop to a low of January 9 at 157.20.
Technical Levels: Supports and Resistances
EURJPY currently trading at 159.29 at the time of writing. Pair opened at 158.68 and is trading with a change of 0.38 % .
| Overview | Overview.1 | |
|---|---|---|
| 0 | Today last price | 159.29 |
| 1 | Today Daily Change | 0.61 |
| 2 | Today Daily Change % | 0.38 |
| 3 | Today daily open | 158.68 |
The pair remains strongly bullish on the daily timeframe. It trades above its 20 SMA @ 157.32, 50 SMA 159.21, 100 SMA @ 158.65 and 200 SMA @ 155.75.
| Trends | Trends.1 | |
|---|---|---|
| 0 | Daily SMA20 | 157.32 |
| 1 | Daily SMA50 | 159.21 |
| 2 | Daily SMA100 | 158.65 |
| 3 | Daily SMA200 | 155.75 |
The previous day high was 159.8 while the previous day low was 158.54. The daily 38.2% Fib levels comes at 159.02, expected to provide support. Similarly, the daily 61.8% fib level is at 159.32, expected to provide resistance.
Note the levels of interest below:
- Pivot support is noted at 158.22, 157.75, 156.96
- Pivot resistance is noted at 159.47, 160.26, 160.73
| Levels | Levels.1 |
|---|---|
| Previous Daily High | 159.80 |
| Previous Daily Low | 158.54 |
| Previous Weekly High | 160.18 |
| Previous Weekly Low | 157.21 |
| Previous Monthly High | 161.78 |
| Previous Monthly Low | 153.17 |
| Daily Fibonacci 38.2% | 159.02 |
| Daily Fibonacci 61.8% | 159.32 |
| Daily Pivot Point S1 | 158.22 |
| Daily Pivot Point S2 | 157.75 |
| Daily Pivot Point S3 | 156.96 |
| Daily Pivot Point R1 | 159.47 |
| Daily Pivot Point R2 | 160.26 |
| Daily Pivot Point R3 | 160.73 |
[/s2If]
Nehcap Trading Strategies
The NEHCAP currently runs the following trading systems for clients. They can be bought and run on your funds.
The system is trading live: LIVE ACCOUNT TRACKING
Contact Us: Contact
The HFT_FIX can be run free for 2 weeks on any broker with a ECN. Apply for a free trial
Join Our Telegram Group


