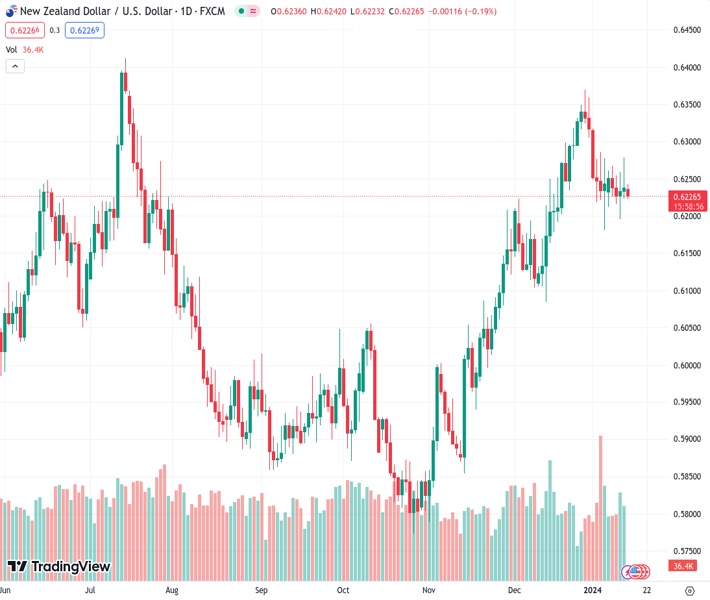
#NZDUSD @ 0.62264 retraces its gains on risk-averse sentiment due to the Middle East situation. (Pivot Orderbook analysis)
…
This is a premium post.
[s2If !current_user_can(access_s2member_level4)]Please register for FREE REGISTER to read full post below containing analysis. In case of any error or you think you are not able to read the full post below, please email us at support#nehcap.com [lwa][/s2If] [s2If current_user_can(access_s2member_level1)]
- NZD/USD retraces its gains on risk-averse sentiment due to the Middle East situation.
- Softer US PPI data boosted the market sentiment toward the Fed rate cut.
- Chinese inflation remains in deflationary territory, keeping the antipodean currencies, including the New Zealand Dollar (NZD).
The pair currently trades last at 0.62264.
The previous day high was 0.6279 while the previous day low was 0.6228. The daily 38.2% Fib levels comes at 0.626, expected to provide resistance. Similarly, the daily 61.8% fib level is at 0.6247, expected to provide resistance.
NZD/USD snaps its two-day winning streak as market sentiment shifts to risk-averse on escalated geopolitical tension in the Middle East. The NZD/USD pair trades lower near 0.6230 during the Asian session on Monday. However, the softer Producer Price Index (PPI) data reinforces market sentiment regarding the possibility of the Federal Reserve (Fed) initiating monetary policy easing. This sentiment has contributed to a weakening of US bond yields, subsequently putting downward pressure on the US Dollar (USD).
Iran-led Houthis launched an anti-ship cruise missile at the USS Laboon in the Red Sea on Monday. This development has contributed support for the Greenback, a safe-haven currency during times of heightened geopolitical uncertainty.
According to the US Bureau of Labor Statistics, the December Producer Price Index (PPI) figure was 1.0% year-on-year, surpassing the previous reading of 0.8%. The Core PPI year-on-year arrived at 1.8%, down from 2.0% in November. The monthly headline and Core PPI indices remained at a 0.1% decline and 0.0%, respectively. These figures indicate a less robust inflationary environment, contributing to the perception of potential monetary policy easing by the Federal Reserve and impacting the US Dollar.
On the New Zealand Dollar (NZD) front, with the absence of high-impact data during the last week, Chinese data was released on Friday. China’s Consumer Price Index (YoY) remained in deflationary territory for the third consecutive month in December.
Additionally, the Chinese Producer Price Index (PPI) experienced a decline for the 15th consecutive month. These developments fuel speculations about the potential for additional government stimulus and provide a modest lift to antipodean currencies, including the New Zealand Dollar (NZD). NZIER Business Confidence and GDT Price Index are scheduled to be released on Friday.
Technical Levels: Supports and Resistances
NZDUSD currently trading at 0.6229 at the time of writing. Pair opened at 0.6243 and is trading with a change of -0.22 % .
| Overview | Overview.1 | |
|---|---|---|
| 0 | Today last price | 0.6229 |
| 1 | Today Daily Change | -0.0014 |
| 2 | Today Daily Change % | -0.2200 |
| 3 | Today daily open | 0.6243 |
The pair is trading below its 20 Daily moving average @ 0.6271, above its 50 Daily moving average @ 0.615 , above its 100 Daily moving average @ 0.6032 and above its 200 Daily moving average @ 0.6092
| Trends | Trends.1 | |
|---|---|---|
| 0 | Daily SMA20 | 0.6271 |
| 1 | Daily SMA50 | 0.6150 |
| 2 | Daily SMA100 | 0.6032 |
| 3 | Daily SMA200 | 0.6092 |
The previous day high was 0.6279 while the previous day low was 0.6228. The daily 38.2% Fib levels comes at 0.626, expected to provide resistance. Similarly, the daily 61.8% fib level is at 0.6247, expected to provide resistance.
Note the levels of interest below:
- Pivot support is noted at 0.6221, 0.6199, 0.617
- Pivot resistance is noted at 0.6272, 0.6301, 0.6323
| Levels | Levels.1 |
|---|---|
| Previous Daily High | 0.6279 |
| Previous Daily Low | 0.6228 |
| Previous Weekly High | 0.6279 |
| Previous Weekly Low | 0.6196 |
| Previous Monthly High | 0.6410 |
| Previous Monthly Low | 0.6084 |
| Daily Fibonacci 38.2% | 0.6260 |
| Daily Fibonacci 61.8% | 0.6247 |
| Daily Pivot Point S1 | 0.6221 |
| Daily Pivot Point S2 | 0.6199 |
| Daily Pivot Point S3 | 0.6170 |
| Daily Pivot Point R1 | 0.6272 |
| Daily Pivot Point R2 | 0.6301 |
| Daily Pivot Point R3 | 0.6323 |
[/s2If]
Nehcap Trading Strategies
The NEHCAP currently runs the following trading systems for clients. They can be bought and run on your funds.
The system is trading live: LIVE ACCOUNT TRACKING
Contact Us: Contact
The HFT_FIX can be run free for 2 weeks on any broker with a ECN. Apply for a free trial
Join Our Telegram Group


