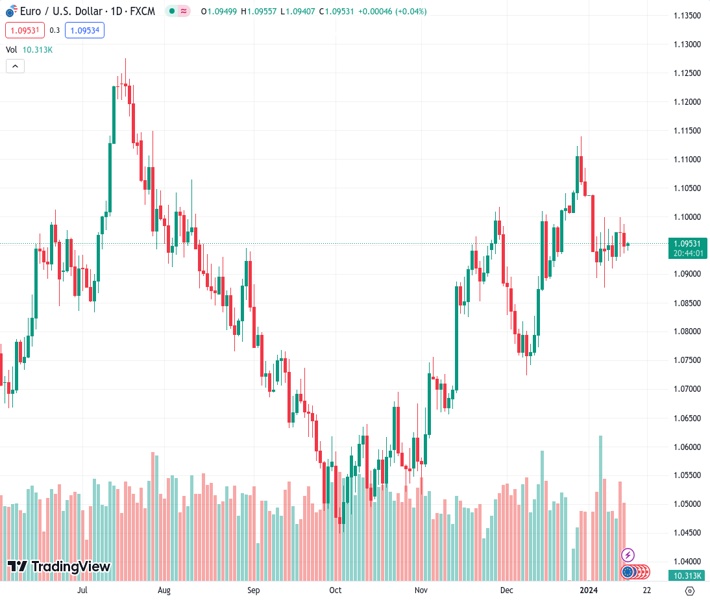
#EURUSD @ 1.09534 holds positive ground above the mid-1.0900s amid the USD weakness. (Pivot Orderbook analysis)
…
This is a premium post.
[s2If !current_user_can(access_s2member_level4)]Please register for FREE REGISTER to read full post below containing analysis. In case of any error or you think you are not able to read the full post below, please email us at support#nehcap.com [lwa][/s2If] [s2If current_user_can(access_s2member_level1)]
- EUR/USD holds positive ground above the mid-1.0900s amid the USD weakness.
- European Central Bank (ECB) officials emphasized the need to wait for more data before making decisions on rate normalization.
- The US Producer Price Index (PPI) unexpectedly dropped in December.
- Investors will focus on Eurozone Industrial Production, due later on Monday.
The pair currently trades last at 1.09534.
The previous day high was 1.0987 while the previous day low was 1.0936. The daily 38.2% Fib levels comes at 1.0955, expected to provide resistance. Similarly, the daily 61.8% fib level is at 1.0967, expected to provide resistance.
The EUR/USD pair posts modest gains during the early Asian session on Monday. The softer US Dollar (USD) and risk-on environment lend some support to the major pair. Due to the lack of top-tier US economic data from the US due to the Martin Luther King Jr. holiday, risk sentiment is anticipated to remain the primary driver of the major pair price movement. EUR/USD currently trades near 1.0953, up 0.03% on the day.
The European Central Bank (ECB) officials emphasized the need to wait for additional economic data before making decisions on rate normalization. On Saturday, ECB chief economist Philip Lane stated that the central bank will have important data by June to decide on a likely series of interest rate cuts, but moving prematurely may prove self-defeating. Last week, ECB President Christine Lagarde said that the ‘hardest and worst bit’ regarding inflation was likely past, and the interest rates would be cut if the ECB had confidence that inflation had fallen below 2%.
Across the pond, the US Producer Price Index (PPI) unexpectedly dropped in December, which triggered the potential that the Federal Reserve (Fed) will begin cutting interest rates this year. According to data released on Friday by the Bureau of Labor Statistics, the PPI rose 1.0% annually in December from November’s reading of 0.8%, while the core PPI was flat for the month, bringing the yearly increase down from 2.0% to 1.8%. With the signal of cooling inflation, investors anticipate additional monetary easing through 2024. The markets place a bet on 160 basis points (bps) of rate cuts from the Fed this year.
Traders will take more cues from ECB speakers this week, including Villeroy (Tuesday) and Nagel (Wednesday). Also, the ECB President Lagarde is set to speak on Wednesday, Thursday, and Friday. Apart from this, ECB Minutes will be released on Thursday.
Technical Levels: Supports and Resistances
EURUSD currently trading at 1.0954 at the time of writing. Pair opened at 1.0951 and is trading with a change of 0.03 % .
| Overview | Overview.1 | |
|---|---|---|
| 0 | Today last price | 1.0954 |
| 1 | Today Daily Change | 0.0003 |
| 2 | Today Daily Change % | 0.0300 |
| 3 | Today daily open | 1.0951 |
The pair is trading below its 20 Daily moving average @ 1.0984, above its 50 Daily moving average @ 1.0898 , above its 100 Daily moving average @ 1.0768 and above its 200 Daily moving average @ 1.0848
| Trends | Trends.1 | |
|---|---|---|
| 0 | Daily SMA20 | 1.0984 |
| 1 | Daily SMA50 | 1.0898 |
| 2 | Daily SMA100 | 1.0768 |
| 3 | Daily SMA200 | 1.0848 |
The previous day high was 1.0987 while the previous day low was 1.0936. The daily 38.2% Fib levels comes at 1.0955, expected to provide resistance. Similarly, the daily 61.8% fib level is at 1.0967, expected to provide resistance.
Note the levels of interest below:
- Pivot support is noted at 1.0929, 1.0907, 1.0878
- Pivot resistance is noted at 1.098, 1.1009, 1.1031
| Levels | Levels.1 |
|---|---|
| Previous Daily High | 1.0987 |
| Previous Daily Low | 1.0936 |
| Previous Weekly High | 1.1004 |
| Previous Weekly Low | 1.0910 |
| Previous Monthly High | 1.1140 |
| Previous Monthly Low | 1.0724 |
| Daily Fibonacci 38.2% | 1.0955 |
| Daily Fibonacci 61.8% | 1.0967 |
| Daily Pivot Point S1 | 1.0929 |
| Daily Pivot Point S2 | 1.0907 |
| Daily Pivot Point S3 | 1.0878 |
| Daily Pivot Point R1 | 1.0980 |
| Daily Pivot Point R2 | 1.1009 |
| Daily Pivot Point R3 | 1.1031 |
[/s2If]
Nehcap Trading Strategies
The NEHCAP currently runs the following trading systems for clients. They can be bought and run on your funds.
The system is trading live: LIVE ACCOUNT TRACKING
Contact Us: Contact
The HFT_FIX can be run free for 2 weeks on any broker with a ECN. Apply for a free trial
Join Our Telegram Group


