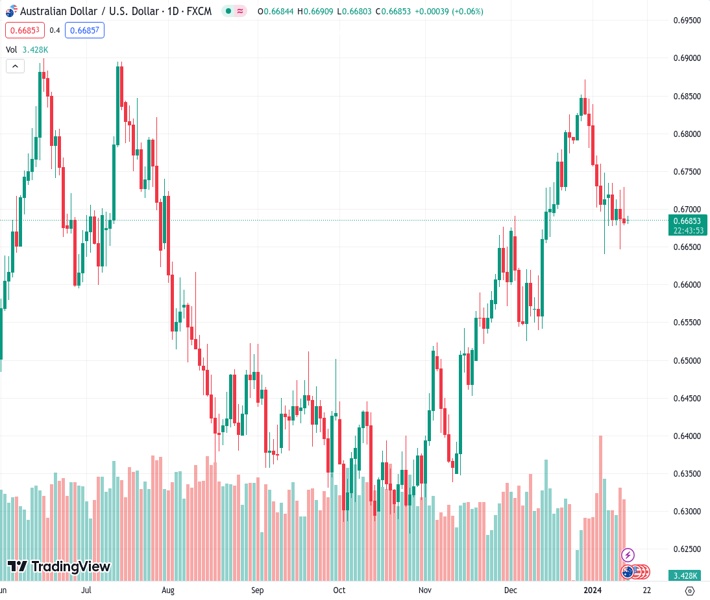
#AUDUSD @ 0.66847 gains ground around 0.6687 on the weaker USD. (Pivot Orderbook analysis)
…
This is a premium post.
[s2If !current_user_can(access_s2member_level4)]Please register for FREE REGISTER to read full post below containing analysis. In case of any error or you think you are not able to read the full post below, please email us at support#nehcap.com [lwa][/s2If] [s2If current_user_can(access_s2member_level1)]
- AUD/USD gains ground around 0.6687 on the weaker USD.
- The December PPI figure showed a cooler headline figure, while the core index was flat.
- China’s Consumer Price Index (CPI) dropped 0.3% from a 0.5% fall seen in November, below the 0.4% decline expected.
The pair currently trades last at 0.66847.
The previous day high was 0.6729 while the previous day low was 0.6678. The daily 38.2% Fib levels comes at 0.6697, expected to provide resistance. Similarly, the daily 61.8% fib level is at 0.6709, expected to provide resistance.
The AUD/USD pair kicks off the new week on a positive note during the early Asian session on Monday. The weaker-than-expected US Producer Price Index (PPI) data on Friday has dragged the US Dollar lower and has lifted AUD/USD. The market is likely to be quiet in terms of US economic data due to a long weekend for the US, with Martin Luther King Jr Day on Monday. The pair currently trades near 0.6687, gaining 0.06% on the day.
The US Bureau of Labor Statistics revealed on Friday that the headline PPI figure for December came in at 1.0% YoY versus 0.8% prior, and the Core PPI arrived at 1.8% YoY from 2.0% in November. Both readings were lower than the market consensus. On a monthly basis, the headline and Core PPI index remained flat at -0.1% and 0%, respectively. In response to the data, the Greenback and US Treasury bond yields edge lower.
According to the CME FedWatch Tool, the market has priced in an 86% odds of a rate cut by March, with the overall 2024 easing cycle priced at around 166 basis points (bps), compared to 75bps projected by the Fed dot plot.
On the other hand, China’s Consumer Price Index (CPI) dropped 0.3% from a 0.5% fall seen in November, below a 0.4% decline expected. Additionally, China’s December exports exceeded estimates, but total trade for the world’s second-biggest economy fell in 2023. Nonetheless, the impact of these figures was limited as market participants focused on the sign of cooling inflation in the United States.
Looking ahead, traders will monitor the Australian Westpac Consumer Confidence for January and TD Securities Inflation data, due on Tuesday. On the US docket, the NY Empire State Manufacturing Index will be due on Tuesday, and the December Retail Sales will be released on Wednesday. These figures could give a clear direction to the AUD/USD pair.
Technical Levels: Supports and Resistances
AUDUSD currently trading at 0.6686 at the time of writing. Pair opened at 0.6683 and is trading with a change of 0.04 % .
| Overview | Overview.1 | |
|---|---|---|
| 0 | Today last price | 0.6686 |
| 1 | Today Daily Change | 0.0003 |
| 2 | Today Daily Change % | 0.0400 |
| 3 | Today daily open | 0.6683 |
The pair is trading below its 20 Daily moving average @ 0.6755, above its 50 Daily moving average @ 0.6632 , above its 100 Daily moving average @ 0.6513 and above its 200 Daily moving average @ 0.6584
| Trends | Trends.1 | |
|---|---|---|
| 0 | Daily SMA20 | 0.6755 |
| 1 | Daily SMA50 | 0.6632 |
| 2 | Daily SMA100 | 0.6513 |
| 3 | Daily SMA200 | 0.6584 |
The previous day high was 0.6729 while the previous day low was 0.6678. The daily 38.2% Fib levels comes at 0.6697, expected to provide resistance. Similarly, the daily 61.8% fib level is at 0.6709, expected to provide resistance.
Note the levels of interest below:
- Pivot support is noted at 0.6665, 0.6646, 0.6614
- Pivot resistance is noted at 0.6715, 0.6747, 0.6766
| Levels | Levels.1 |
|---|---|
| Previous Daily High | 0.6729 |
| Previous Daily Low | 0.6678 |
| Previous Weekly High | 0.6735 |
| Previous Weekly Low | 0.6647 |
| Previous Monthly High | 0.6871 |
| Previous Monthly Low | 0.6526 |
| Daily Fibonacci 38.2% | 0.6697 |
| Daily Fibonacci 61.8% | 0.6709 |
| Daily Pivot Point S1 | 0.6665 |
| Daily Pivot Point S2 | 0.6646 |
| Daily Pivot Point S3 | 0.6614 |
| Daily Pivot Point R1 | 0.6715 |
| Daily Pivot Point R2 | 0.6747 |
| Daily Pivot Point R3 | 0.6766 |
[/s2If]
Nehcap Trading Strategies
The NEHCAP currently runs the following trading systems for clients. They can be bought and run on your funds.
The system is trading live: LIVE ACCOUNT TRACKING
Contact Us: Contact
The HFT_FIX can be run free for 2 weeks on any broker with a ECN. Apply for a free trial
Join Our Telegram Group


