#XAGUSD @ 23.188 Silver’s recent rally to $23.52 curbed by resistance at 50 and 200-DMAs, leading to a slight pullback in prices. (Pivot Orderbook analysis)
…
This is a premium post.
[s2If !current_user_can(access_s2member_level4)]Please register for FREE REGISTER to read full post below containing analysis. In case of any error or you think you are not able to read the full post below, please email us at support#nehcap.com [lwa][/s2If] [s2If current_user_can(access_s2member_level1)]
- Silver’s recent rally to $23.52 curbed by resistance at 50 and 200-DMAs, leading to a slight pullback in prices.
- Technical analysis shows Silver trading in a sideways trend; immediate support at $23.00, followed by $22.48.
- Potential for further gains if Silver breaks above the 100-DMA at $23.25, targeting the $23.60/65 resistance zone.
The pair currently trades last at 23.188.
The previous day high was 23.16 while the previous day low was 22.48. The daily 38.2% Fib levels comes at 22.74, expected to provide support. Similarly, the daily 61.8% fib level is at 22.9, expected to provide support.
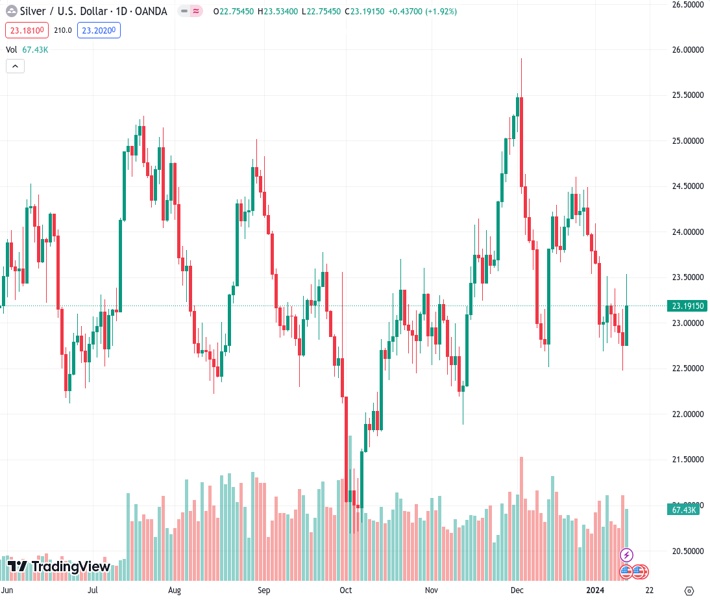
Silver price trims its losses, but it remains below the 100-day moving average (DMA) after hitting a new five-day high of $23.52 on Friday. Geopolitical tensions bolstered the grey metal, which aimed towards the confluence of the 50 and 200-DMAs, but buyers’ failure to crack that area opened the door for a pullback. The XAG/USD trades at $23.15, up by 1.85%.
The non-yielding metal remains sideways, though slightly tilted to the downside after buyers failed to conquer the confluence of the 50 and 200-DMAs. With Silver spot price trading below the 200-DMA, the first support is seen at $23.00 a troy ounce. A breach of the latter will expose the January 11 low at $22.48, followed by the $22.00 mark. Once that support level is broken, up next would be the November 13 cycle low of $21.88.
In the outcome of buyers stepping in, they would clash with the 100-DMA at $23.25. A breach of the latter will expose the confluence of the 50 and 200-DMAs at around $23.60/65, before opening the path toward $24.00.
Technical Levels: Supports and Resistances
XAGUSD currently trading at 23.16 at the time of writing. Pair opened at 22.74 and is trading with a change of 1.85 % .
| Overview | Overview.1 | |
|---|---|---|
| 0 | Today last price | 23.16 |
| 1 | Today Daily Change | 0.42 |
| 2 | Today Daily Change % | 1.85 |
| 3 | Today daily open | 22.74 |
The pair remains strongly bearish on the daily time frame. It trades below the 20 SMA @ 23.66, 50 SMA 23.66, 100 SMA @ 23.28 and 200 SMA @ 23.63.
| Trends | Trends.1 | |
|---|---|---|
| 0 | Daily SMA20 | 23.66 |
| 1 | Daily SMA50 | 23.66 |
| 2 | Daily SMA100 | 23.28 |
| 3 | Daily SMA200 | 23.63 |
The previous day high was 23.16 while the previous day low was 22.48. The daily 38.2% Fib levels comes at 22.74, expected to provide support. Similarly, the daily 61.8% fib level is at 22.9, expected to provide support.
Note the levels of interest below:
- Pivot support is noted at 22.43, 22.11, 21.75
- Pivot resistance is noted at 23.11, 23.47, 23.79
| Levels | Levels.1 |
|---|---|
| Previous Daily High | 23.16 |
| Previous Daily Low | 22.48 |
| Previous Weekly High | 24.09 |
| Previous Weekly Low | 22.69 |
| Previous Monthly High | 25.92 |
| Previous Monthly Low | 22.51 |
| Daily Fibonacci 38.2% | 22.74 |
| Daily Fibonacci 61.8% | 22.90 |
| Daily Pivot Point S1 | 22.43 |
| Daily Pivot Point S2 | 22.11 |
| Daily Pivot Point S3 | 21.75 |
| Daily Pivot Point R1 | 23.11 |
| Daily Pivot Point R2 | 23.47 |
| Daily Pivot Point R3 | 23.79 |
[/s2If]
Nehcap Trading Strategies
The NEHCAP currently runs the following trading systems for clients. They can be bought and run on your funds.
The system is trading live: LIVE ACCOUNT TRACKING
Contact Us: Contact
The HFT_FIX can be run free for 2 weeks on any broker with a ECN. Apply for a free trial
Join Our Telegram Group


