WTI rose on Friday after markets were gripped once more by geopolitical concerns. (Pivot Orderbook analysis)
…
This is a premium post.
[s2If !current_user_can(access_s2member_level4)]Please register for FREE REGISTER to read full post below containing analysis. In case of any error or you think you are not able to read the full post below, please email us at support#nehcap.com [lwa][/s2If] [s2If current_user_can(access_s2member_level1)]
- WTI rose on Friday after markets were gripped once more by geopolitical concerns.
- Chinese Crude Oil demand recovered on Friday, further boosting the day’s bids.
- Oil markets settled back into familiar lows as the trading week drew to a close.
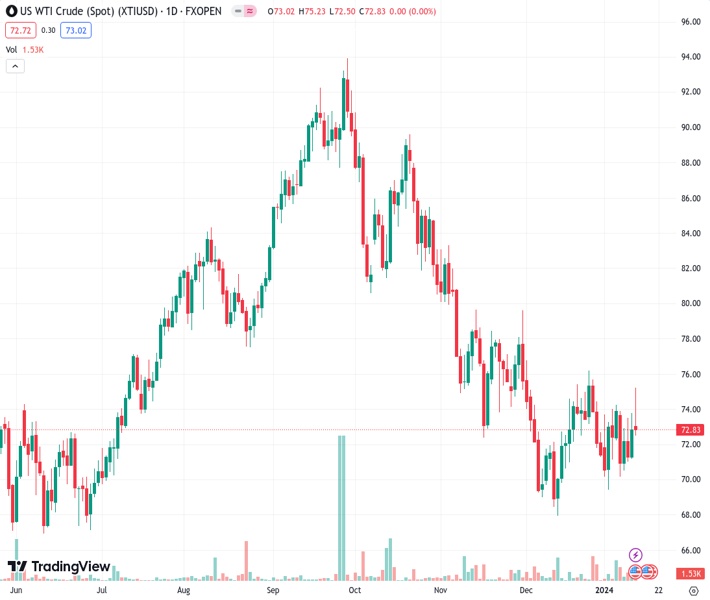
The pair currently trades last at 72.85.
The previous day high was 73.8 while the previous day low was 71.23. The daily 38.2% Fib levels comes at 72.82, expected to provide support. Similarly, the daily 61.8% fib level is at 72.21, expected to provide support.
West Texas Intermediate (WTI) US Crude Oil rose to a new 2024 high of $75.27 on Friday, with energy markets growing increasingly nervous about spill-over from ongoing geopolitical tensions after naval forces from the US and UK launched attacks on Houthi rebel forces that have been targeting civilian cargo and tanker ships off the coast of Yemen. Houthi attacks on ships bound for the Suez Canal have gripped oil markets in recent weeks as supply chains connecting Europe and the Middle East see shipping lanes diverted around the African continent.
Chinese demand for Crude Oil set a record high in 2023, easing market concerns about declining fossil fuel demand from China, who is grappling with a slowing economy and lopsided growth.
Crude Oil markets surged on combined headlines, driving WTI briefly above $75.00 before US Producer Price Index (PPI) figures missed market expectations. Markets broadly pivoted into renewed expectations of Federal Reserve (Fed) rate hikes before global markets settled back, dragging Crude Oil lower once more. WTI settled back below $73.00 per barrel as investors take stock and gear up for another weekend thick with geopolitical headlines.
Friday saw WTI US Crude Oil attempt a run higher before getting knocked back towards near-term median bids, climbing to WTI’s highest bids since late December before slipping back into familiar consolidation that has plagued Crude Oil since a tumble late in Q3 2023.
Near-term price action remains constrained close to the 200-hour Simple Moving Average (SMA) near $72.50, with an immediate technical floor priced in at the last swing low just above $71.00.
Upside momentum in WTI remains capped by a declining 50-day SMA falling into $74.00, with long-term price action on the south side of the 200-day SMA near $78.00.
Technical Levels: Supports and Resistances
XTIUSD currently trading at 72.85 at the time of writing. Pair opened at 72.47 and is trading with a change of 0.52 % .
| Overview | Overview.1 | |
|---|---|---|
| 0 | Today last price | 72.85 |
| 1 | Today Daily Change | 0.38 |
| 2 | Today Daily Change % | 0.52 |
| 3 | Today daily open | 72.47 |
The pair is trading above its 20 Daily moving average @ 72.79, below its 50 Daily moving average @ 74.15 , below its 100 Daily moving average @ 80.07 and below its 200 Daily moving average @ 77.6
| Trends | Trends.1 | |
|---|---|---|
| 0 | Daily SMA20 | 72.79 |
| 1 | Daily SMA50 | 74.15 |
| 2 | Daily SMA100 | 80.07 |
| 3 | Daily SMA200 | 77.60 |
The previous day high was 73.8 while the previous day low was 71.23. The daily 38.2% Fib levels comes at 72.82, expected to provide support. Similarly, the daily 61.8% fib level is at 72.21, expected to provide support.
Note the levels of interest below:
- Pivot support is noted at 71.2, 69.93, 68.64
- Pivot resistance is noted at 73.77, 75.06, 76.33
| Levels | Levels.1 |
|---|---|
| Previous Daily High | 73.80 |
| Previous Daily Low | 71.23 |
| Previous Weekly High | 74.28 |
| Previous Weekly Low | 69.41 |
| Previous Monthly High | 76.79 |
| Previous Monthly Low | 67.97 |
| Daily Fibonacci 38.2% | 72.82 |
| Daily Fibonacci 61.8% | 72.21 |
| Daily Pivot Point S1 | 71.20 |
| Daily Pivot Point S2 | 69.93 |
| Daily Pivot Point S3 | 68.64 |
| Daily Pivot Point R1 | 73.77 |
| Daily Pivot Point R2 | 75.06 |
| Daily Pivot Point R3 | 76.33 |
[/s2If]
Nehcap Trading Strategies
The NEHCAP currently runs the following trading systems for clients. They can be bought and run on your funds.
The system is trading live: LIVE ACCOUNT TRACKING
Contact Us: Contact
The HFT_FIX can be run free for 2 weeks on any broker with a ECN. Apply for a free trial
Join Our Telegram Group


