#EURUSD @ 1.09387 falls sharply below 1.0950 on deepening geopolitical tensions. (Pivot Orderbook analysis)
…
This is a premium post.
[s2If !current_user_can(access_s2member_level4)]Please register for FREE REGISTER to read full post below containing analysis. In case of any error or you think you are not able to read the full post below, please email us at support#nehcap.com [lwa][/s2If] [s2If current_user_can(access_s2member_level1)]
- EUR/USD falls sharply below 1.0950 on deepening geopolitical tensions.
- Fears of widening conflicts in Middle East region have improved the safe-haven appeal.
- The ECB is not required to raise interest rates further.
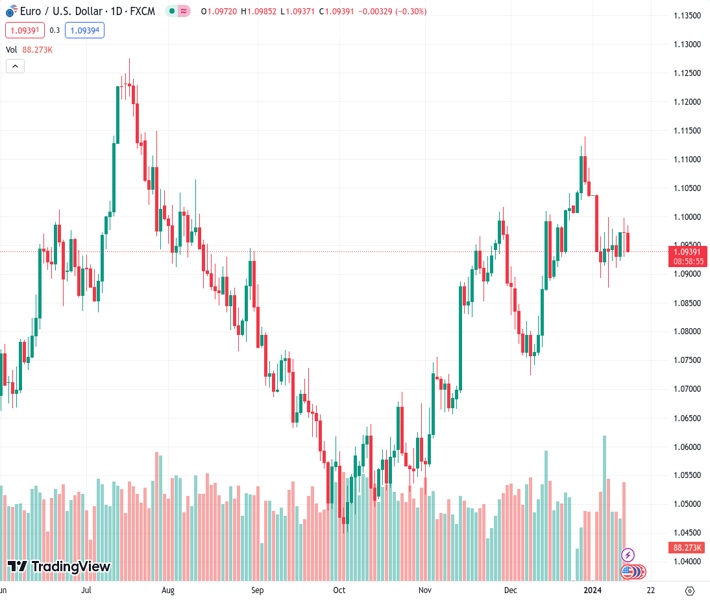
The pair currently trades last at 1.09387.
The previous day high was 1.1004 while the previous day low was 1.093. The daily 38.2% Fib levels comes at 1.0976, expected to provide resistance. Similarly, the daily 61.8% fib level is at 1.0958, expected to provide resistance.
The EUR/USD pair has slipped below the crucial support of 1.0950 as the market mood has turned risk-averse amid deepening Middle East tensions. The major currency pair has been hit hard as demand for safe-haven assets has improved significantly.
S&P500 futures are facing significant losses in the late European session, indicating a sharp decline in the risk-appetite of the market participants. Fears of widening conflicts in the Middle East region after US airstrikes on Iran-backed Houthi rebels in retaliation for striking on commercial oil shipments from Red Sea has dampened the market sentiment.
The US Dollar Index (DXY) has rebounded sharply above 102.50, supported by stubbornly higher United States inflation and geopolitical tensions. The US headline inflation accelerated sharply in December amid elevating rental prices and healthcare costs. While bets supporting a rate cut by the Federal Reserve (Fed) in March are still firm.
As per the CME Fedwatch tool, chances in favour of a rate cut by 25 basis points (bps) in March are slightly above 68%.
Meanwhile, investors await the US Producer Price Index (PPI) data for December, which will be published at 13:30 GMT. The annual headline PPI is forecasted to grow strongly by 1.3% against 0.9% gain in November. In the same period, core PPI that excludes volatile food and oil prices is seen decelerating to 1.9% against 2.0%.
On the Eurozone front, European Central Bank (ECB) President Christine Lagarde has confirmed that the central bank is done with hiking interest rates. She added that worst about inflation is behind us but rate cuts would come if the central bank gets certain about inflation declining towards 2%. While asked about economic shrinkage, Lagarde said the Euro zone is not in an official recession.
Technical Levels: Supports and Resistances
EURUSD currently trading at 1.0947 at the time of writing. Pair opened at 1.0972 and is trading with a change of -0.23 % .
| Overview | Overview.1 | |
|---|---|---|
| 0 | Today last price | 1.0947 |
| 1 | Today Daily Change | -0.0025 |
| 2 | Today Daily Change % | -0.2300 |
| 3 | Today daily open | 1.0972 |
The pair is trading below its 20 Daily moving average @ 1.0981, above its 50 Daily moving average @ 1.0893 , above its 100 Daily moving average @ 1.0766 and above its 200 Daily moving average @ 1.0848
| Trends | Trends.1 | |
|---|---|---|
| 0 | Daily SMA20 | 1.0981 |
| 1 | Daily SMA50 | 1.0893 |
| 2 | Daily SMA100 | 1.0766 |
| 3 | Daily SMA200 | 1.0848 |
The previous day high was 1.1004 while the previous day low was 1.093. The daily 38.2% Fib levels comes at 1.0976, expected to provide resistance. Similarly, the daily 61.8% fib level is at 1.0958, expected to provide resistance.
Note the levels of interest below:
- Pivot support is noted at 1.0933, 1.0895, 1.086
- Pivot resistance is noted at 1.1007, 1.1042, 1.108
| Levels | Levels.1 |
|---|---|
| Previous Daily High | 1.1004 |
| Previous Daily Low | 1.0930 |
| Previous Weekly High | 1.1046 |
| Previous Weekly Low | 1.0877 |
| Previous Monthly High | 1.1140 |
| Previous Monthly Low | 1.0724 |
| Daily Fibonacci 38.2% | 1.0976 |
| Daily Fibonacci 61.8% | 1.0958 |
| Daily Pivot Point S1 | 1.0933 |
| Daily Pivot Point S2 | 1.0895 |
| Daily Pivot Point S3 | 1.0860 |
| Daily Pivot Point R1 | 1.1007 |
| Daily Pivot Point R2 | 1.1042 |
| Daily Pivot Point R3 | 1.1080 |
[/s2If]
Nehcap Trading Strategies
The NEHCAP currently runs the following trading systems for clients. They can be bought and run on your funds.
The system is trading live: LIVE ACCOUNT TRACKING
Contact Us: Contact
The HFT_FIX can be run free for 2 weeks on any broker with a ECN. Apply for a free trial
Join Our Telegram Group
")


