#USDCAD @ 1.33529 moves on a downward path as Crude oil prices improve. (Pivot Orderbook analysis)
…
This is a premium post.
[s2If !current_user_can(access_s2member_level4)]Please register for FREE REGISTER to read full post below containing analysis. In case of any error or you think you are not able to read the full post below, please email us at support#nehcap.com [lwa][/s2If] [s2If current_user_can(access_s2member_level1)]
- USD/CAD moves on a downward path as Crude oil prices improve.
- The weekly low at 1.3340 could act as immediate support followed by the psychological level at 1.3300.
- A break above 1.3400 could prompt the pair to approach the 38.2% Fibonacci retracement level at 1.3450 and the 50-day EMA at 1.3454.
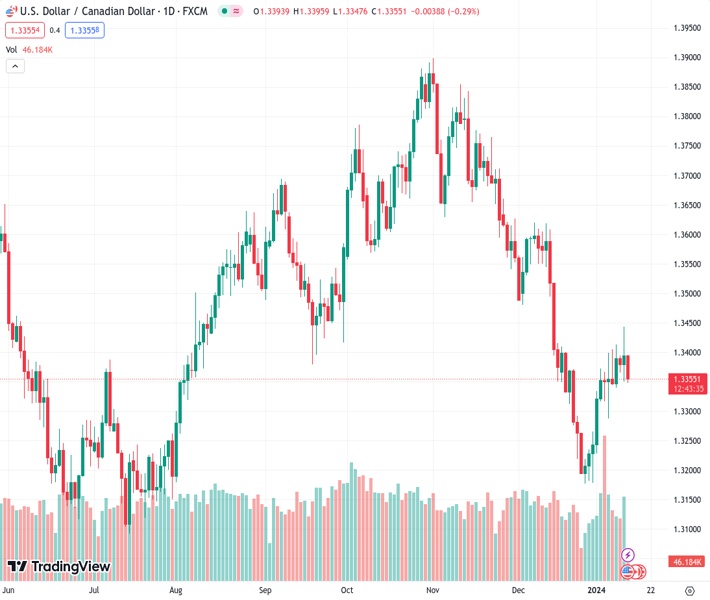
The pair currently trades last at 1.33529.
The previous day high was 1.3443 while the previous day low was 1.3351. The daily 38.2% Fib levels comes at 1.3408, expected to provide resistance. Similarly, the daily 61.8% fib level is at 1.3386, expected to provide resistance.
USD/CAD retraces its recent gains recorded on Thursday, trading lower near 1.3350 during the European session on Friday. The Canadian Dollar (CAD) is strengthening, influenced by the positive movement in Crude oil prices. This uptick in oil prices is attributed to escalating tensions in the Middle East following military attacks by the US and UK on Iran-backed Houthi locations in Yemen.
The weekly low at 1.3340 is seen as the immediate support for the USD/CAD pair. If this level is breached, it could potentially lead the pair to test the psychological level at 1.3300, with further downside potential towards the major support at the 1.3250 level.
A break below the 1.3250 level could result in the USD/CAD pair navigating the region around the previous week’s low at 1.3228, followed by the psychological level at 1.3200.
The technical analysis of the Moving Average Convergence Divergence (MACD) for the USD/CAD pair indicates a potential trend shift, as the MACD line is positioned below the centerline but exhibits divergence above the signal line.
However, the lagging indicator, the 14-day Relative Strength Index (RSI), is positioned below 50. Traders are likely to exercise caution and await confirmation, suggesting that the USD/CAD pair may be on the verge of changing its direction.
The analysis suggests that on the upside, the psychological level at 1.3400 could act as the key resistance. A breakthrough above the key resistance zone could lead the USD/CAD pair to approach the 38.2% Fibonacci retracement level at 1.3450 aligned with the 50-day Exponential Moving Average (EMA) at 1.3454.
Technical Levels: Supports and Resistances
USDCAD currently trading at 1.3354 at the time of writing. Pair opened at 1.3398 and is trading with a change of -0.33 % .
| Overview | Overview.1 | |
|---|---|---|
| 0 | Today last price | 1.3354 |
| 1 | Today Daily Change | -0.0044 |
| 2 | Today Daily Change % | -0.3300 |
| 3 | Today daily open | 1.3398 |
The pair is trading above its 20 Daily moving average @ 1.3318, below its 50 Daily moving average @ 1.3516 , below its 100 Daily moving average @ 1.3572 and below its 200 Daily moving average @ 1.348
| Trends | Trends.1 | |
|---|---|---|
| 0 | Daily SMA20 | 1.3318 |
| 1 | Daily SMA50 | 1.3516 |
| 2 | Daily SMA100 | 1.3572 |
| 3 | Daily SMA200 | 1.3480 |
The previous day high was 1.3443 while the previous day low was 1.3351. The daily 38.2% Fib levels comes at 1.3408, expected to provide resistance. Similarly, the daily 61.8% fib level is at 1.3386, expected to provide resistance.
Note the levels of interest below:
- Pivot support is noted at 1.3352, 1.3305, 1.3259
- Pivot resistance is noted at 1.3444, 1.349, 1.3536
| Levels | Levels.1 |
|---|---|
| Previous Daily High | 1.3443 |
| Previous Daily Low | 1.3351 |
| Previous Weekly High | 1.3399 |
| Previous Weekly Low | 1.3229 |
| Previous Monthly High | 1.3620 |
| Previous Monthly Low | 1.3178 |
| Daily Fibonacci 38.2% | 1.3408 |
| Daily Fibonacci 61.8% | 1.3386 |
| Daily Pivot Point S1 | 1.3352 |
| Daily Pivot Point S2 | 1.3305 |
| Daily Pivot Point S3 | 1.3259 |
| Daily Pivot Point R1 | 1.3444 |
| Daily Pivot Point R2 | 1.3490 |
| Daily Pivot Point R3 | 1.3536 |
[/s2If]
Nehcap Trading Strategies
The NEHCAP currently runs the following trading systems for clients. They can be bought and run on your funds.
The system is trading live: LIVE ACCOUNT TRACKING
Contact Us: Contact
The HFT_FIX can be run free for 2 weeks on any broker with a ECN. Apply for a free trial
Join Our Telegram Group
")


