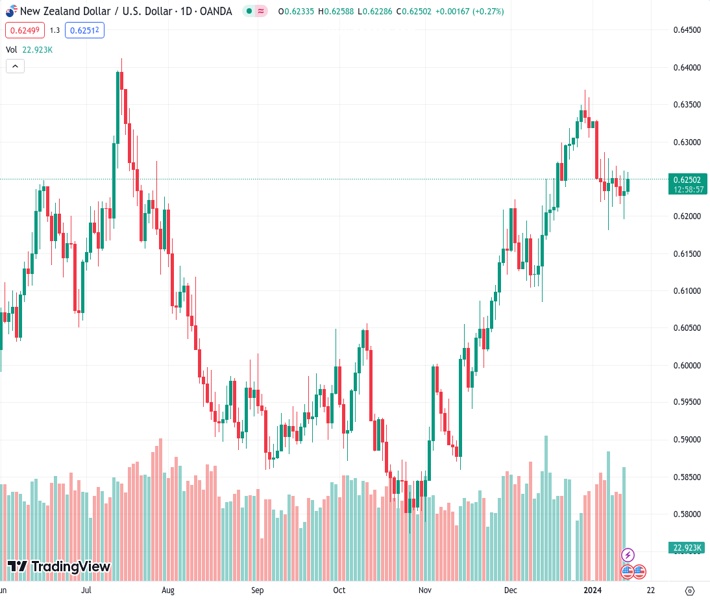
#NZDUSD @ 0.62498 scales higher for the second straight day and is supported by a combination of factors. (Pivot Orderbook analysis)
…
This is a premium post.
[s2If !current_user_can(access_s2member_level4)]Please register for FREE REGISTER to read full post below containing analysis. In case of any error or you think you are not able to read the full post below, please email us at support#nehcap.com [lwa][/s2If] [s2If current_user_can(access_s2member_level1)]
- NZD/USD scales higher for the second straight day and is supported by a combination of factors.
- Expectations for additional stimulus from China boosts antipodean currencies, including the Kiwi.
- The Fed rate uncertainty keeps the USD bulls on the defensive and acts as a tailwind for the pair.
The pair currently trades last at 0.62498.
The previous day high was 0.626 while the previous day low was 0.6196. The daily 38.2% Fib levels comes at 0.6235, expected to provide support. Similarly, the daily 61.8% fib level is at 0.622, expected to provide support.
The NZD/USD pair builds on the overnight bounce from the sub-0.6200 levels, or the weekly low, and gains positive traction for the second successive day on Friday. Spot prices stick to modest intraday gains through the first half of the European session and currently trade around the mid-0.6200s, closer to the top end of the weekly range.
The National Bureau of Statistics reported that consumer prices in China remained in deflationary territory for the third straight month in December. Furthermore, the Producer Price Index (PPI), which measures costs for goods at the factory gate, fell for the 15th straight month. This, in turn, fuels speculations about additional government stimulus and provides a modest lift to antipodean currencies, including the New Zealand Dollar (NZD).
Meanwhile, the US Dollar (USD) remains confined in a familiar range held over the past week or so amid the uncertainty over the Federal Reserve’s (Fed) interest rate trajectory. This turns out to be another factor lending support to the NZD/USD pair. That said, diminishing odds for a more aggressive policy easing acts as a tailwind for the US Treasury bond yields, which, along with geopolitical risks, limit losses for the safe-haven Greenback.
Apart from this, persistent worries about the worsening economic conditions in China might hold back traders from placing fresh bullish bets around the NZD/USD pair and should cap any meaningful appreciating move. The fears resurfaced after data showed that China’s imports grew less than expected in December, which pointed to still weak domestic demand. This offsets upbeat export figures, which indicate that global trade is starting to recover.
The aforementioned mixed fundamental backdrop, along with the NZD/USD pair’s recent range-bound price action witnessed over the past week or so, makes it prudent to wait for strong follow-through buying before placing fresh bullish bets. Traders now look to the release of the US Producer Price Index (PPI). This, along with a scheduled speech by Minneapolis Fed President Neel Kashkari, might provide some impetus during the North American session.
Technical Levels: Supports and Resistances
NZDUSD currently trading at 0.625 at the time of writing. Pair opened at 0.6232 and is trading with a change of 0.29 % .
| Overview | Overview.1 | |
|---|---|---|
| 0 | Today last price | 0.6250 |
| 1 | Today Daily Change | 0.0018 |
| 2 | Today Daily Change % | 0.2900 |
| 3 | Today daily open | 0.6232 |
The pair is trading below its 20 Daily moving average @ 0.6269, above its 50 Daily moving average @ 0.6145 , above its 100 Daily moving average @ 0.6029 and above its 200 Daily moving average @ 0.6092
| Trends | Trends.1 | |
|---|---|---|
| 0 | Daily SMA20 | 0.6269 |
| 1 | Daily SMA50 | 0.6145 |
| 2 | Daily SMA100 | 0.6029 |
| 3 | Daily SMA200 | 0.6092 |
The previous day high was 0.626 while the previous day low was 0.6196. The daily 38.2% Fib levels comes at 0.6235, expected to provide support. Similarly, the daily 61.8% fib level is at 0.622, expected to provide support.
Note the levels of interest below:
- Pivot support is noted at 0.6199, 0.6165, 0.6134
- Pivot resistance is noted at 0.6263, 0.6294, 0.6327
| Levels | Levels.1 |
|---|---|
| Previous Daily High | 0.6260 |
| Previous Daily Low | 0.6196 |
| Previous Weekly High | 0.6339 |
| Previous Weekly Low | 0.6181 |
| Previous Monthly High | 0.6410 |
| Previous Monthly Low | 0.6084 |
| Daily Fibonacci 38.2% | 0.6235 |
| Daily Fibonacci 61.8% | 0.6220 |
| Daily Pivot Point S1 | 0.6199 |
| Daily Pivot Point S2 | 0.6165 |
| Daily Pivot Point S3 | 0.6134 |
| Daily Pivot Point R1 | 0.6263 |
| Daily Pivot Point R2 | 0.6294 |
| Daily Pivot Point R3 | 0.6327 |
[/s2If]
Nehcap Trading Strategies
The NEHCAP currently runs the following trading systems for clients. They can be bought and run on your funds.
The system is trading live: LIVE ACCOUNT TRACKING
Contact Us: Contact
The HFT_FIX can be run free for 2 weeks on any broker with a ECN. Apply for a free trial
Join Our Telegram Group
")


