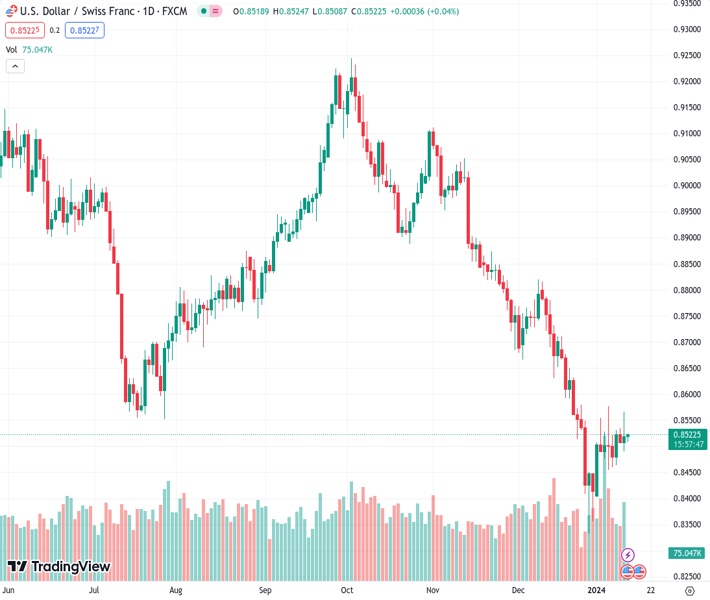
#USDCHF @ 0.85221 oscillates in a trading band around 0.8520 on Friday. (Pivot Orderbook analysis)
…
This is a premium post.
[s2If !current_user_can(access_s2member_level4)]Please register for FREE REGISTER to read full post below containing analysis. In case of any error or you think you are not able to read the full post below, please email us at support#nehcap.com [lwa][/s2If] [s2If current_user_can(access_s2member_level1)]
- USD/CHF oscillates in a trading band around 0.8520 on Friday.
- The upbeat US inflation and labor market data could challenge an expected March rate cut by the Federal Reserve (Fed).
- The escalating tension in the Middle East might benefit the safe haven currency like the Swiss Franc (CHF).
- The December US Producer Price Index (PPI) will be the highlight on Friday.
The pair currently trades last at 0.85221.
The previous day high was 0.8566 while the previous day low was 0.8491. The daily 38.2% Fib levels comes at 0.8538, expected to provide resistance. Similarly, the daily 61.8% fib level is at 0.852, expected to provide support.
The USD/CHF pair remains confined within a multi-week trading range of 0.8400-0.8575 during the early European trading hours on Friday. The firmer US Dollar (USD) following the upbeat US inflation data might lend some support to the pair. However, the upside of USD/CHF might be limited due to the escalating tension in the Middle East. At press time, the pair is trading at 0.8520, losing 0.02% on the day.
Inflation ticked higher in the United States in December. According to the Bureau of Labor Statistics, the US headline Consumer Price Index (CPI), rose at an annual pace of 3.4% in December from 3.1% in the previous month, beating expectations of 3.2%. On a monthly basis, the CPI figure grew by 0.3% from 0.1% in November. That being said, the upbeat US inflation and labor market data could potentially push back an expected March rate cut by the Federal Reserve (Fed).
On the other hand, the escalating tension in the Middle East might lift the safe haven flow like the Swiss Franc (CHF). On Thursday, the US and UK forces carried out attacks against multiple Houthi targets in Houthi-controlled regions of Yemen. US President Joe Biden said that “these strikes are in direct response to Houthi attacks against international maritime vessels in the Red Sea.”
Earlier this week, the Swiss Consumer Price Index (CPI) for December came in better than expected, climbing to 1.7% YoY from 1.4% in the previous reading. The Real Retail Sales arrived at 0.7% in November versus -0.3% prior, beating the estimation.
Moving on, the December US Producer Price Index (PPI) will be due later on Friday, which is forecast to rise 0.1% MoM and 1.3% YoY. Traders will take more cues from these data and find trading opportunities around the USD/CHF pair.
Technical Levels: Supports and Resistances
USDCHF currently trading at 0.8518 at the time of writing. Pair opened at 0.8523 and is trading with a change of -0.06 % .
| Overview | Overview.1 | |
|---|---|---|
| 0 | Today last price | 0.8518 |
| 1 | Today Daily Change | -0.0005 |
| 2 | Today Daily Change % | -0.0600 |
| 3 | Today daily open | 0.8523 |
The pair remains strongly bearish on the daily time frame. It trades below the 20 SMA @ 0.8529, 50 SMA 0.8716, 100 SMA @ 0.8857 and 200 SMA @ 0.8875.
| Trends | Trends.1 | |
|---|---|---|
| 0 | Daily SMA20 | 0.8529 |
| 1 | Daily SMA50 | 0.8716 |
| 2 | Daily SMA100 | 0.8857 |
| 3 | Daily SMA200 | 0.8875 |
The previous day high was 0.8566 while the previous day low was 0.8491. The daily 38.2% Fib levels comes at 0.8538, expected to provide resistance. Similarly, the daily 61.8% fib level is at 0.852, expected to provide support.
Note the levels of interest below:
- Pivot support is noted at 0.8487, 0.8451, 0.8412
- Pivot resistance is noted at 0.8563, 0.8602, 0.8638
| Levels | Levels.1 |
|---|---|
| Previous Daily High | 0.8566 |
| Previous Daily Low | 0.8491 |
| Previous Weekly High | 0.8578 |
| Previous Weekly Low | 0.8399 |
| Previous Monthly High | 0.8821 |
| Previous Monthly Low | 0.8333 |
| Daily Fibonacci 38.2% | 0.8538 |
| Daily Fibonacci 61.8% | 0.8520 |
| Daily Pivot Point S1 | 0.8487 |
| Daily Pivot Point S2 | 0.8451 |
| Daily Pivot Point S3 | 0.8412 |
| Daily Pivot Point R1 | 0.8563 |
| Daily Pivot Point R2 | 0.8602 |
| Daily Pivot Point R3 | 0.8638 |
[/s2If]
Nehcap Trading Strategies
The NEHCAP currently runs the following trading systems for clients. They can be bought and run on your funds.
The system is trading live: LIVE ACCOUNT TRACKING
Contact Us: Contact
The HFT_FIX can be run free for 2 weeks on any broker with a ECN. Apply for a free trial
Join Our Telegram Group
")


