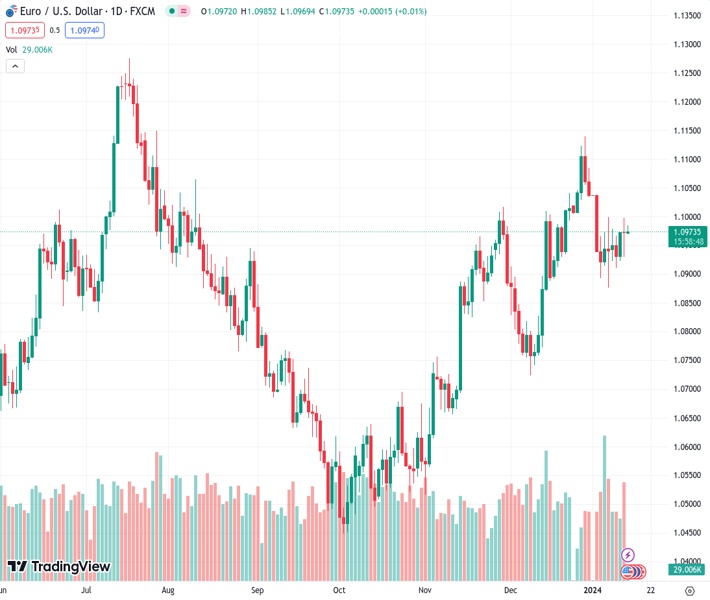
#EURUSD @ 1.09768 extends gains as the US Dollar declines on risk-on mood. (Pivot Orderbook analysis)
…
This is a premium post.
[s2If !current_user_can(access_s2member_level4)]Please register for FREE REGISTER to read full post below containing analysis. In case of any error or you think you are not able to read the full post below, please email us at support#nehcap.com [lwa][/s2If] [s2If current_user_can(access_s2member_level1)]
- EUR/USD extends gains as the US Dollar declines on risk-on mood.
- MACD suggests waiting for the confirmation of bullish sentiment in the pair.
- A break above 1.1000 could propel the pair to reach the previous week’s high at 1.1038.
The pair currently trades last at 1.09768.
The previous day high was 1.1004 while the previous day low was 1.093. The daily 38.2% Fib levels comes at 1.0976, expected to provide support. Similarly, the daily 61.8% fib level is at 1.0958, expected to provide support.
EUR/USD continues to gain ground for the third successive day, trading higher around 1.0980 during the Asian session on Friday. The EUR/USD pair receives upward support due to the subdued US Dollar (USD), a trend attributed to the market’s expectations of five rate cuts by the Federal Reserve by the end of 2024, beginning with anticipated cuts in March and May.
The EUR/USD pair could face resistance at the psychological level of 1.1000. A successful breakthrough above this level could potentially provide support for the pair to revisit the high from the previous week at 1.1038. The 14-day Relative Strength Index (RSI) for the EUR/USD pair is positioned above the 50 mark, indicating a bullish momentum in the market.
However, the Moving Average Convergence Divergence (MACD) line, despite being positioned above the centerline, is converging below the signal line. This indicates a potential momentum shift toward an upward trend for the EUR/USD pair. Traders are likely to exercise caution and await confirmation before making aggressive bets in the pair, taking into consideration the signals provided by this lagging indicator.
On the downside, the EUR/USD pair faces the possibility of breaking below the immediate support at the 23.6% Fibonacci retracement level, marked at 1.0964, followed by the key level of 1.0950. If the immediate support area is breached, it could prompt the pair to approach the psychological level of 1.0900.
A decisive break below the latter could intensify downward pressure on the EUR/USD pair, potentially guiding it toward the 50-day Exponential Moving Average (EMA) at 1.0895 and the 38.2% Fibonacci retracement level at 1.0867. Further downside movement may lead to a significant support level at 1.0850. Traders may closely monitor these key levels for potential shifts in market dynamics.
Technical Levels: Supports and Resistances
EURUSD currently trading at 1.0976 at the time of writing. Pair opened at 1.0972 and is trading with a change of 0.04 % .
| Overview | Overview.1 | |
|---|---|---|
| 0 | Today last price | 1.0976 |
| 1 | Today Daily Change | 0.0004 |
| 2 | Today Daily Change % | 0.0400 |
| 3 | Today daily open | 1.0972 |
The pair is trading below its 20 Daily moving average @ 1.0981, above its 50 Daily moving average @ 1.0893 , above its 100 Daily moving average @ 1.0766 and above its 200 Daily moving average @ 1.0848
| Trends | Trends.1 | |
|---|---|---|
| 0 | Daily SMA20 | 1.0981 |
| 1 | Daily SMA50 | 1.0893 |
| 2 | Daily SMA100 | 1.0766 |
| 3 | Daily SMA200 | 1.0848 |
The previous day high was 1.1004 while the previous day low was 1.093. The daily 38.2% Fib levels comes at 1.0976, expected to provide support. Similarly, the daily 61.8% fib level is at 1.0958, expected to provide support.
Note the levels of interest below:
- Pivot support is noted at 1.0933, 1.0895, 1.086
- Pivot resistance is noted at 1.1007, 1.1042, 1.108
| Levels | Levels.1 |
|---|---|
| Previous Daily High | 1.1004 |
| Previous Daily Low | 1.0930 |
| Previous Weekly High | 1.1046 |
| Previous Weekly Low | 1.0877 |
| Previous Monthly High | 1.1140 |
| Previous Monthly Low | 1.0724 |
| Daily Fibonacci 38.2% | 1.0976 |
| Daily Fibonacci 61.8% | 1.0958 |
| Daily Pivot Point S1 | 1.0933 |
| Daily Pivot Point S2 | 1.0895 |
| Daily Pivot Point S3 | 1.0860 |
| Daily Pivot Point R1 | 1.1007 |
| Daily Pivot Point R2 | 1.1042 |
| Daily Pivot Point R3 | 1.1080 |
[/s2If]
Nehcap Trading Strategies
The NEHCAP currently runs the following trading systems for clients. They can be bought and run on your funds.
The system is trading live: LIVE ACCOUNT TRACKING
Contact Us: Contact
The HFT_FIX can be run free for 2 weeks on any broker with a ECN. Apply for a free trial
Join Our Telegram Group
")


