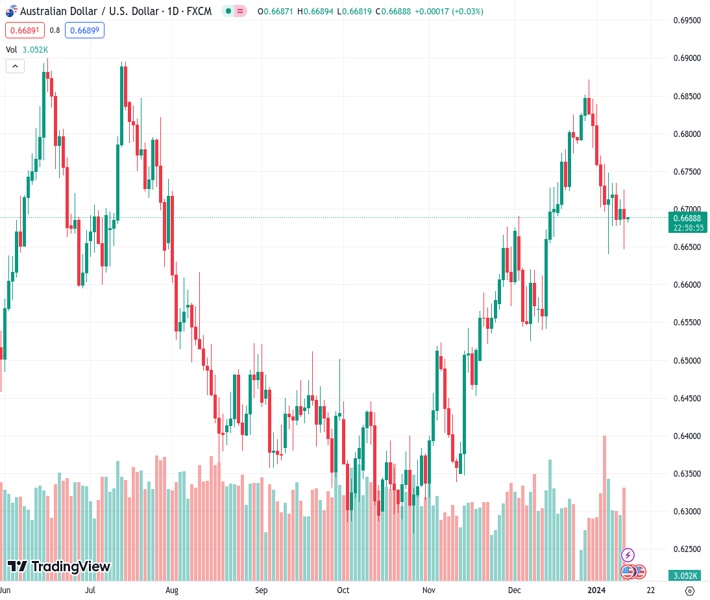
#AUDUSD @ 0.66880 attracts some sellers amid the rebound of USD. (Pivot Orderbook analysis)
…
This is a premium post.
[s2If !current_user_can(access_s2member_level4)]Please register for FREE REGISTER to read full post below containing analysis. In case of any error or you think you are not able to read the full post below, please email us at support#nehcap.com [lwa][/s2If] [s2If current_user_can(access_s2member_level1)]
- AUD/USD attracts some sellers amid the rebound of USD.
- US headline CPI for December rose 0.3% MoM vs. 0.1% prior; the Core CPI figure grew 0.3% MoM.
- Australian Trade Balance jumped to 11.437M in November.
- Chinese CPI and US PPI reports will be in the spotlight on Friday.
The pair currently trades last at 0.66880.
The previous day high was 0.6713 while the previous day low was 0.668. The daily 38.2% Fib levels comes at 0.67, expected to provide resistance. Similarly, the daily 61.8% fib level is at 0.6693, expected to provide resistance.
The AUD/USD pair remains on the defensive during the early Asian session on Friday. The pair edges lower on the stronger-than-expected December US inflation figures. Investors await China’s inflation and Trade Data on Friday for fresh impetus. AUD/USD currently trades around 0.6688, up 0.03% on the day.
Data from the US Bureau of Labor Statistics revealed on Thursday that the headline Consumer Price Index (CPI) for December rose 0.3% MoM from 0.1% in the previous reading, above the market consensus of 0.2%. The Core CPI figure grew 0.3% MoM while the annual rate climbed 3.9% YoY versus 4.0% prior, better than the 3.8% estimated.
The upbeat US CPI data and labor market data last week prompted investors to question the Federal Reserve’s (Fed) plan to cut interest rates in the second quarter. This, in turn, boosts the US Dollar (USD) and acts as a headwind for the AUD/USD pair.
On the Aussie front, the Australian Trade Balance jumped to 11.437M in November. Meanwhile, Goods and Services Exports came in at 1.7% on a monthly basis versus 0.4% prior, and Imports fell 7.9% in December MoM versus a 1.9% drop prior.
Apart from this, China’s Consumer Price Index (CPI), Producer Price Index (PPI) and Trade Balance will be released on Friday. If the report shows a better outcome, this could boost the China-proxy Australian Dollar.
Moving on, attention will shift to the US Producer Price Index (PPI) for December, which is projected to show an increase of 0.1% MoM and 1.3%, respectively. The annual Core PPI is estimated to ease to 1.9% YoY versus 2.0% prior. These figures could give a clear direction to the AUD/USD pair.
Technical Levels: Supports and Resistances
AUDUSD currently trading at 0.6689 at the time of writing. Pair opened at 0.6697 and is trading with a change of -0.12 % .
| Overview | Overview.1 | |
|---|---|---|
| 0 | Today last price | 0.6689 |
| 1 | Today Daily Change | -0.0008 |
| 2 | Today Daily Change % | -0.1200 |
| 3 | Today daily open | 0.6697 |
The pair is trading below its 20 Daily moving average @ 0.6757, above its 50 Daily moving average @ 0.6623 , above its 100 Daily moving average @ 0.6507 and above its 200 Daily moving average @ 0.6583
| Trends | Trends.1 | |
|---|---|---|
| 0 | Daily SMA20 | 0.6757 |
| 1 | Daily SMA50 | 0.6623 |
| 2 | Daily SMA100 | 0.6507 |
| 3 | Daily SMA200 | 0.6583 |
The previous day high was 0.6713 while the previous day low was 0.668. The daily 38.2% Fib levels comes at 0.67, expected to provide resistance. Similarly, the daily 61.8% fib level is at 0.6693, expected to provide resistance.
Note the levels of interest below:
- Pivot support is noted at 0.668, 0.6664, 0.6648
- Pivot resistance is noted at 0.6713, 0.6729, 0.6746
| Levels | Levels.1 |
|---|---|
| Previous Daily High | 0.6713 |
| Previous Daily Low | 0.6680 |
| Previous Weekly High | 0.6839 |
| Previous Weekly Low | 0.6641 |
| Previous Monthly High | 0.6871 |
| Previous Monthly Low | 0.6526 |
| Daily Fibonacci 38.2% | 0.6700 |
| Daily Fibonacci 61.8% | 0.6693 |
| Daily Pivot Point S1 | 0.6680 |
| Daily Pivot Point S2 | 0.6664 |
| Daily Pivot Point S3 | 0.6648 |
| Daily Pivot Point R1 | 0.6713 |
| Daily Pivot Point R2 | 0.6729 |
| Daily Pivot Point R3 | 0.6746 |
[/s2If]
Nehcap Trading Strategies
The NEHCAP currently runs the following trading systems for clients. They can be bought and run on your funds.
The system is trading live: LIVE ACCOUNT TRACKING
Contact Us: Contact
The HFT_FIX can be run free for 2 weeks on any broker with a ECN. Apply for a free trial
Join Our Telegram Group
")


