#XAGUSD @ 22.695 Silver’s volatility driven by recent US CPI figures showing higher headline inflation, sparking concerns over Fed’s policy path. (Pivot Orderbook analysis)
…
This is a premium post.
[s2If !current_user_can(access_s2member_level4)]Please register for FREE REGISTER to read full post below containing analysis. In case of any error or you think you are not able to read the full post below, please email us at support#nehcap.com [lwa][/s2If] [s2If current_user_can(access_s2member_level1)]
- Silver’s volatility driven by recent US CPI figures showing higher headline inflation, sparking concerns over Fed’s policy path.
- Fed officials’ cautious remarks on rate cuts contribute to market uncertainty, influencing Silver’s price dynamics.
- Decline in US Treasury yields, particularly at the short end, adds pressure on the Dollar, impacting precious metal markets.
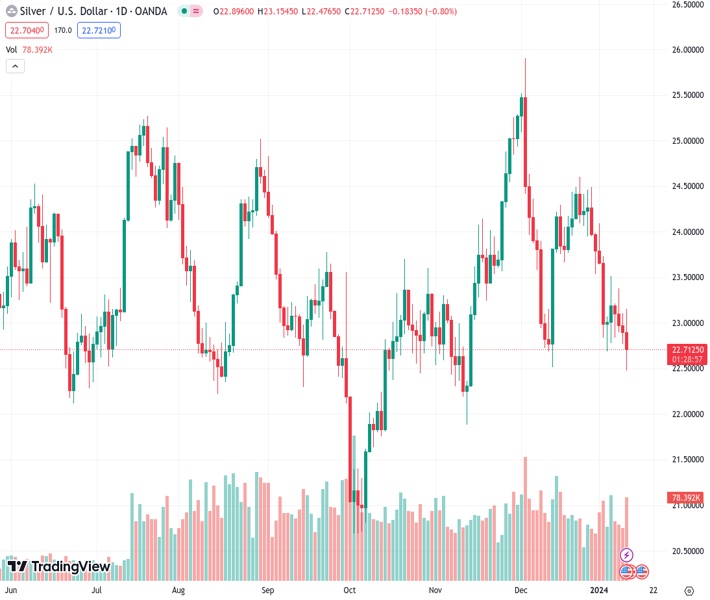
The pair currently trades last at 22.695.
The previous day high was 23.11 while the previous day low was 22.77. The daily 38.2% Fib levels comes at 22.9, expected to provide resistance. Similarly, the daily 61.8% fib level is at 22.98, expected to provide resistance.
Silver price remained volatile during Thursday’s session after data from the United States (US) probed that inflation is stickier than expected, while Federal Reserve (Fed) officials commented that it’s too soon to expect a rate cut in March’s meeting. The XAG/USD exchanges hands at $22.70, down 0.77%.
Fundamentally speaking, the fall of US Treasury yields eased the pressure off Silver prices, which hit a two-month low of $22.48, before trimming its losses. Headline inflation in the US rose by 3.4% YoY exceeding forecasts for an uptick of just 3.2%. The same report revealed that core numbers dipped below 4% YoY, lower than November’s data, though they exceeded estimates.
In the meantime, some Fed officials had stressed that although progress on lowering inflation is seen, the latest reports suggest it’s becoming stickier than expected. Even though they had opened the door to ease monetary policy at some point, they remained muted about providing clues regarding the first cut.
Despite that, US Treasury yields are falling off the cliff, with the short end of the curve dropping twice the basis points compared to the belly. The US 2-year Treasury note yield is down ten basis points, at 4.26%, while the 10-year note yield sits at 3.98%, down by four basis points. This is weighing on the Greenback as the US Dollar Index (DXY) pares its earlier gains, almost flat at 102.39.
Silver’s is neutral to downward biased, though it faced solid support at around $22.51, the latest cycle low hit on December 13, with buyers stepping in and lifting the XAG/USD spot toward current levels. Nevertheless, if Silver finishes the session below $23.00, that will keep buyers pressured. XAG/USD’s first support would be the January 11 low of $22.48, followed by $22.00 a troy ounce, ahead of the November 13 low of $21.88. Otherwise, if buyers reclaim $23.00, that could open the door to challenge the 100-day moving average (DMA) at around $23.26.
Technical Levels: Supports and Resistances
XAGUSD currently trading at 22.71 at the time of writing. Pair opened at 22.88 and is trading with a change of -0.74 % .
| Overview | Overview.1 | |
|---|---|---|
| 0 | Today last price | 22.71 |
| 1 | Today Daily Change | -0.17 |
| 2 | Today Daily Change % | -0.74 |
| 3 | Today daily open | 22.88 |
The pair remains strongly bearish on the daily time frame. It trades below the 20 SMA @ 23.73, 50 SMA 23.66, 100 SMA @ 23.29 and 200 SMA @ 23.64.
| Trends | Trends.1 | |
|---|---|---|
| 0 | Daily SMA20 | 23.73 |
| 1 | Daily SMA50 | 23.66 |
| 2 | Daily SMA100 | 23.29 |
| 3 | Daily SMA200 | 23.64 |
The previous day high was 23.11 while the previous day low was 22.77. The daily 38.2% Fib levels comes at 22.9, expected to provide resistance. Similarly, the daily 61.8% fib level is at 22.98, expected to provide resistance.
Note the levels of interest below:
- Pivot support is noted at 22.73, 22.59, 22.4
- Pivot resistance is noted at 23.07, 23.25, 23.4
| Levels | Levels.1 |
|---|---|
| Previous Daily High | 23.11 |
| Previous Daily Low | 22.77 |
| Previous Weekly High | 24.09 |
| Previous Weekly Low | 22.69 |
| Previous Monthly High | 25.92 |
| Previous Monthly Low | 22.51 |
| Daily Fibonacci 38.2% | 22.90 |
| Daily Fibonacci 61.8% | 22.98 |
| Daily Pivot Point S1 | 22.73 |
| Daily Pivot Point S2 | 22.59 |
| Daily Pivot Point S3 | 22.40 |
| Daily Pivot Point R1 | 23.07 |
| Daily Pivot Point R2 | 23.25 |
| Daily Pivot Point R3 | 23.40 |
[/s2If]
Nehcap Trading Strategies
The NEHCAP currently runs the following trading systems for clients. They can be bought and run on your funds.
The system is trading live: LIVE ACCOUNT TRACKING
Contact Us: Contact
The HFT_FIX can be run free for 2 weeks on any broker with a ECN. Apply for a free trial
Join Our Telegram Group
")


