#NZDJPY @ 90.7080 pair currently posts minor losses at 90.70. (Pivot Orderbook analysis)
…
This is a premium post.
[s2If !current_user_can(access_s2member_level4)]Please register for FREE REGISTER to read full post below containing analysis. In case of any error or you think you are not able to read the full post below, please email us at support#nehcap.com [lwa][/s2If] [s2If current_user_can(access_s2member_level1)]
- NZD/JPY pair currently posts minor losses at 90.70.
- Daily RSI hovers in the bullish area while the MACD’s histogram exhibits signs of slowing buyer momentum.
- Indicators in the four-hour chart are decelerating.
The pair currently trades last at 90.7080.
The previous day high was 0.6255 while the previous day low was 0.6215. The daily 38.2% Fib levels comes at 0.623, expected to provide support. Similarly, the daily 61.8% fib level is at 0.624, expected to provide support.
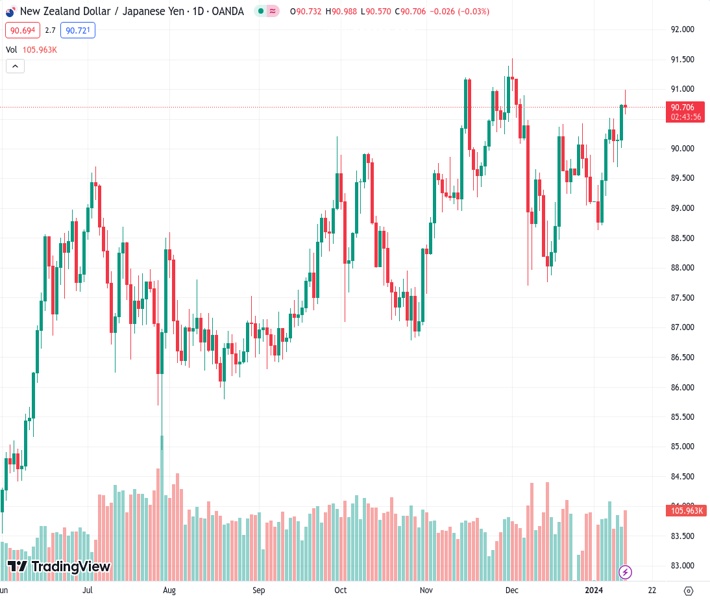
On Thursday’s session, the NZD/JPY pair is observed at around 90.70, registering slight losses after hitting high of around 91.00. The daily chart signals a bullish sentiment as bulls are gaining ground, while the four-hour chart presents consolidating indicators, suggesting a potential breather in the NZD/JPY’s rally.
An examination of the daily chart reveals a long-term bullish momentum for the cross. The pair is situated above all its key Simple Moving Averages (SMAs) comprising the 20, 100, and 200-day SMAs. Furthermore, the Relative Strength Index (RSI) is exhibiting a stable performance within the positive precincts, while the Moving Average Convergence Divergence (MACD) highlights green bars, albeit in a stationary phase.
Shifting to the shorter time frame, pointers from the four-hour chart narrate a somewhat different tale, with a consolidation phase currently underway. The Relative Strength Index (RSI) remains within positive territory but with a declining trajectory. In unison, the Moving Average Convergence Divergence (MACD) flaunts flat, inviting green bars. These characteristics indicate some level of buying momentum but are constrained as investors seem to be taking profits.
Technical Levels: Supports and Resistances
NZDJPY currently trading at 0.6216 at the time of writing. Pair opened at 0.6222 and is trading with a change of -0.1 % .
| Overview | Overview.1 | |
|---|---|---|
| 0 | Today last price | 0.6216 |
| 1 | Today Daily Change | -0.0006 |
| 2 | Today Daily Change % | -0.1000 |
| 3 | Today daily open | 0.6222 |
The pair is trading below its 20 Daily moving average @ 0.6268, above its 50 Daily moving average @ 0.6138 , above its 100 Daily moving average @ 0.6026 and above its 200 Daily moving average @ 0.6092
| Trends | Trends.1 | |
|---|---|---|
| 0 | Daily SMA20 | 0.6268 |
| 1 | Daily SMA50 | 0.6138 |
| 2 | Daily SMA100 | 0.6026 |
| 3 | Daily SMA200 | 0.6092 |
The previous day high was 0.6255 while the previous day low was 0.6215. The daily 38.2% Fib levels comes at 0.623, expected to provide support. Similarly, the daily 61.8% fib level is at 0.624, expected to provide support.
Note the levels of interest below:
- Pivot support is noted at 0.6206, 0.6191, 0.6166
- Pivot resistance is noted at 0.6246, 0.6271, 0.6286
| Levels | Levels.1 |
|---|---|
| Previous Daily High | 0.6255 |
| Previous Daily Low | 0.6215 |
| Previous Weekly High | 0.6339 |
| Previous Weekly Low | 0.6181 |
| Previous Monthly High | 0.6410 |
| Previous Monthly Low | 0.6084 |
| Daily Fibonacci 38.2% | 0.6230 |
| Daily Fibonacci 61.8% | 0.6240 |
| Daily Pivot Point S1 | 0.6206 |
| Daily Pivot Point S2 | 0.6191 |
| Daily Pivot Point S3 | 0.6166 |
| Daily Pivot Point R1 | 0.6246 |
| Daily Pivot Point R2 | 0.6271 |
| Daily Pivot Point R3 | 0.6286 |
[/s2If]
Nehcap Trading Strategies
The NEHCAP currently runs the following trading systems for clients. They can be bought and run on your funds.
The system is trading live: LIVE ACCOUNT TRACKING
Contact Us: Contact
The HFT_FIX can be run free for 2 weeks on any broker with a ECN. Apply for a free trial
Join Our Telegram Group
")


