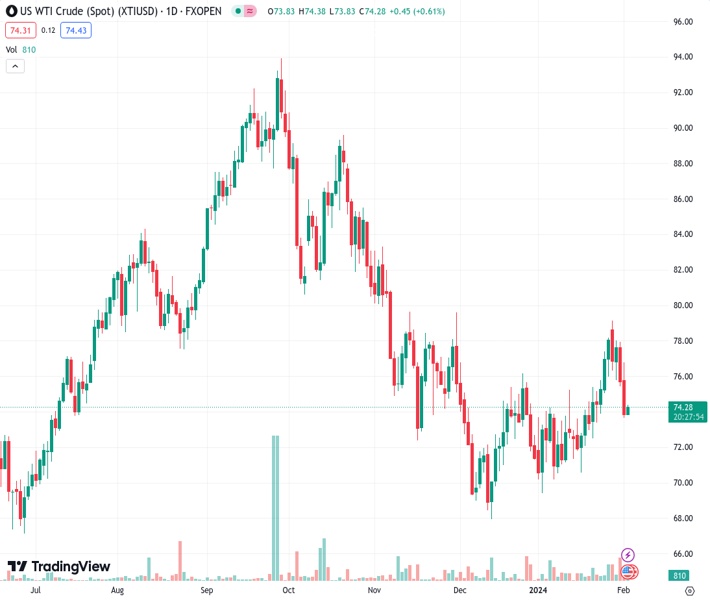
WTI prices recover some lost ground near $74.30 on Friday. (Pivot Orderbook analysis)
…
This is a premium post.
[s2If !current_user_can(access_s2member_level4)]Please register for FREE REGISTER to read full post below containing analysis. In case of any error or you think you are not able to read the full post below, please email us at support#nehcap.com [lwa][/s2If] [s2If current_user_can(access_s2member_level1)]
- WTI prices recover some lost ground near $74.30 on Friday.
- The modest recovery in WTI prices is backed by expectations for Fed rate cuts and Chinese stimulus measures.
- The US Nonfarm Payrolls report will be in the spotlight on Friday.
The pair currently trades last at 74.37.
The previous day high was 76.84 while the previous day low was 73.7. The daily 38.2% Fib levels comes at 74.9, expected to provide resistance. Similarly, the daily 61.8% fib level is at 75.64, expected to provide resistance.
Western Texas Intermediate (WTI), the US crude oil benchmark, is trading around $74.30 on Friday. WTI prices snap the two-day losing streak amid the sign of potential interest rate cuts from the US Federal Reserve (Fed).
The modest recovery in WTI prices is supported by the market’s expectations for rate cuts this year after Fed Chair Jerome Powell indicated a peak of the rate hiking cycle during the press conference. It’s worth noting that lower interest rates typically stimulate economic growth which buoys oil demand.
China has revealed measures to encourage development in its faltering property sector. Chinese authorities’ emergency reaction and $1 trillion (US$141 billion) yuan liquidity injection helped boost market confidence. The positive developments surrounding China’s economy might lift WTI prices, as China is the world’s second-largest oil consumer.
On Thursday, the Organization of the Petroleum Exporting Countries (OPEC) committee said that the group’s members will discuss in March whether or not to extend voluntary oil production cuts in place for the first quarter. The committee said there would be no changes to OPEC’s decision to slash 2.2 million barrels per day from the market this quarter.
Oil traders will closely watch the US Nonfarm Payrolls on Friday. Additionally, the Unemployment Rate, Average Hourly Earnings, Factory Orders, and the final reading of the Michigan Consumer Sentiment will also be released later in the day. These events could significantly impact the USD-denominated WTI price. Oil traders will take cues from the data and find trading opportunities around WTI prices.
Technical Levels: Supports and Resistances
XTIUSD currently trading at 74.37 at the time of writing. Pair opened at 73.82 and is trading with a change of 0.75 % .
| Overview | Overview.1 | |
|---|---|---|
| 0 | Today last price | 74.37 |
| 1 | Today Daily Change | 0.55 |
| 2 | Today Daily Change % | 0.75 |
| 3 | Today daily open | 73.82 |
The pair is trading above its 20 Daily moving average @ 74.13, above its 50 Daily moving average @ 73.42 , below its 100 Daily moving average @ 78.52 and below its 200 Daily moving average @ 77.25
| Trends | Trends.1 | |
|---|---|---|
| 0 | Daily SMA20 | 74.13 |
| 1 | Daily SMA50 | 73.42 |
| 2 | Daily SMA100 | 78.52 |
| 3 | Daily SMA200 | 77.25 |
The previous day high was 76.84 while the previous day low was 73.7. The daily 38.2% Fib levels comes at 74.9, expected to provide resistance. Similarly, the daily 61.8% fib level is at 75.64, expected to provide resistance.
Note the levels of interest below:
- Pivot support is noted at 72.73, 71.64, 69.59
- Pivot resistance is noted at 75.87, 77.92, 79.01
| Levels | Levels.1 |
|---|---|
| Previous Daily High | 76.84 |
| Previous Daily Low | 73.70 |
| Previous Weekly High | 78.20 |
| Previous Weekly Low | 72.55 |
| Previous Monthly High | 79.19 |
| Previous Monthly Low | 69.41 |
| Daily Fibonacci 38.2% | 74.90 |
| Daily Fibonacci 61.8% | 75.64 |
| Daily Pivot Point S1 | 72.73 |
| Daily Pivot Point S2 | 71.64 |
| Daily Pivot Point S3 | 69.59 |
| Daily Pivot Point R1 | 75.87 |
| Daily Pivot Point R2 | 77.92 |
| Daily Pivot Point R3 | 79.01 |
[/s2If]
Nehcap Trading Strategies
The NEHCAP currently runs the following trading systems for clients. They can be bought and run on your funds.
The system is trading live: LIVE ACCOUNT TRACKING
Contact Us: Contact
The HFT_FIX can be run free for 2 weeks on any broker with a ECN. Apply for a free trial
Join Our Telegram Group
")


