N
…
This is a premium post.
[s2If !current_user_can(access_s2member_level4)]Please register for FREE REGISTER to read full post below containing analysis. In case of any error or you think you are not able to read the full post below, please email us at support#nehcap.com [lwa][/s2If] [s2If current_user_can(access_s2member_level1)]
- N
- atural Gas trades near $2 – though above the lowest level of $2.04, seen Thursday.
- Traders are seeing a rebound in European industrial output stall because of uncertainties.
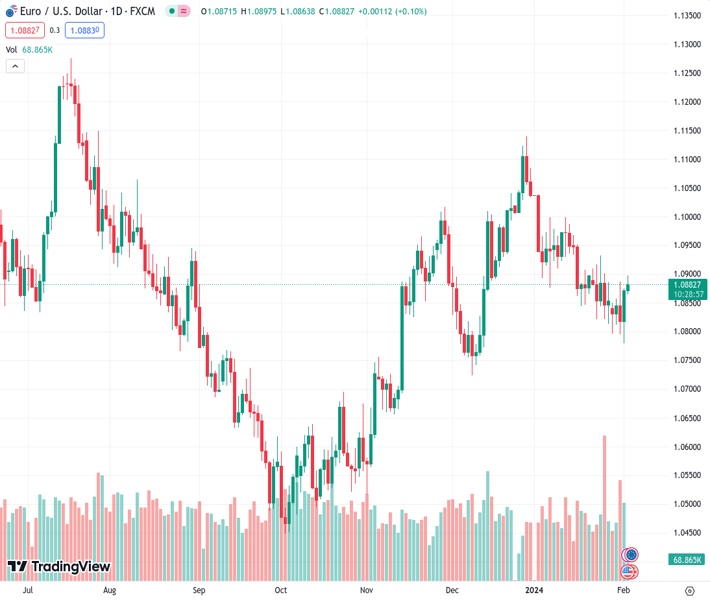
- The US Dollar Index sinks into the 102-area ahead of the US Jobs Report.
Natural Gas (XNG/USD) is jumping off the fresh four-year low that got printed on Thursday at $2.04. The jump in Natural Gas comes after the US okayed plans for military strikes in both Iraq and Syria. Meanwhile a cease fire between Israel and Hamas did not go through after Hamas backtracked on earlier commitments it agreed on the terms.
The US Dollar (USD), which is negatively correlated to Nat Gas, had a meltdown overnight where traders sold the Greenback after US Jobless data started to signal a possible tipping point. The US Challenger Job Cuts data revealed more than double the amount of layoffs in January compared to December while both Initial and Continuing Jobless Claims are starting to tick up against last week. A big miss on the US Jobs Report might mean more substantial weakness for the Greenback going forward.
Natural Gas is trading at $2.08 per MMBtu at the time of writing.
Natural Gas is trading on the verge of either breaking below $2.00 or jumping back above $2.10. Although Qatar said that Israel agreed to a ceasefire deal on the table, Hamas is not ready to do so. The risk of no ceasefire or a ceasefire deal at the weekend could mean a jump in both Oil and Gas prices on possible uncertainty.
On the upside, Natural Gas is facing some pivotal technical levels to get back to. First, the low of January at $2.10 needs to be reclaimed again. Next is the intermediary level near $2.48. Once that area gets hit, expect to see a test near $2.57 at the purple line.
Once the current low at $2.04 gets tested, or broken again, expect the $2.00 big figure to crack under pressure as well. The first level to look for on the downside is near $1.96 (orange level) which goes back to August 2020. Next is the red line near $1.51, the low of June 2021.
XNG/USD (Daily Chart)
[/s2If]
Nehcap Trading Strategies
The NEHCAP currently runs the following trading systems for clients. They can be bought and run on your funds.
The system is trading live: LIVE ACCOUNT TRACKING
Contact Us: Contact
The HFT_FIX can be run free for 2 weeks on any broker with a ECN. Apply for a free trial
Join Our Telegram Group
")


