WTI price moves higher on concerns over global supply disruptions. (Pivot Orderbook analysis)
…
This is a premium post.
[s2If !current_user_can(access_s2member_level4)]Please register for FREE REGISTER to read full post below containing analysis. In case of any error or you think you are not able to read the full post below, please email us at support#nehcap.com [lwa][/s2If] [s2If current_user_can(access_s2member_level1)]
- WTI price moves higher on concerns over global supply disruptions.
- Ukraine conducted a drone attack on a Russian fuel terminal Novatek.
- US-led coalition continues air strikes against Iran-backed Houthi terrorist targets in Yemen.
- Libya’s Sharara oilfield resumed operations to bring back the supply of 270,000 bpd.
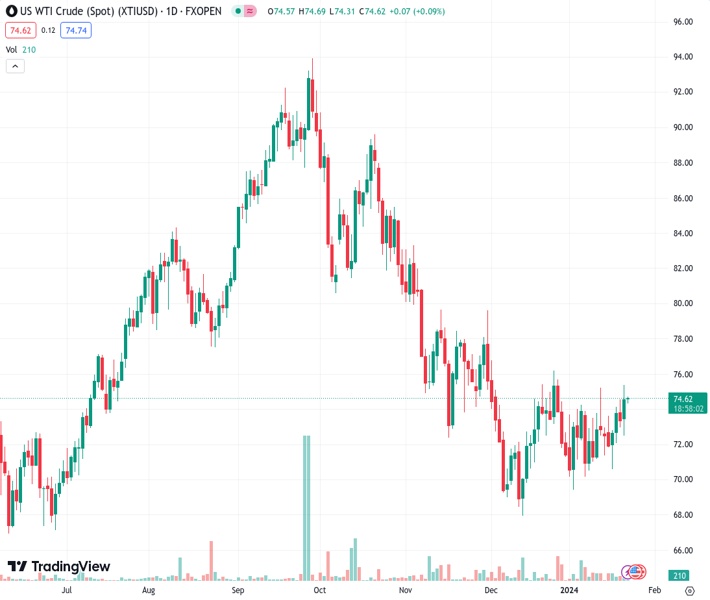
The pair currently trades last at 74.68.
The previous day high was 75.43 while the previous day low was 72.55. The daily 38.2% Fib levels comes at 74.33, expected to provide support. Similarly, the daily 61.8% fib level is at 73.65, expected to provide support.
West Texas Intermediate (WTI) price extends its gains for the second successive session, improving to near $74.70 per barrel during the Asian session on Tuesday. The rise in Crude oil prices is attributed to concerns over global energy supplies, sparked by a drone strike on Russia’s Novatek by Ukraine. Additionally, disruptions in Crude production from the United States (US) due to extreme cold weather have contributed to the upward pressure on oil prices.
Reports from both the BBC and the Wall Street Journal indicate that Ukraine conducted a drone attack on a Russian fuel terminal using explosives. Furthermore, North Dakota’s pipeline authority has stated that over 20% of the state’s oil output remained shut in on Monday due to severe cold weather. These developments highlight the multifaceted factors influencing oil markets, which can contribute to fluctuations in Crude oil prices.
The situation in the Red Sea is becoming increasingly precarious as Iran-backed Houthi rebels continue to escalate attacks on maritime ships. This poses a significant risk to oil supply disruptions, especially in the context of mounting instability that could potentially spill over into the Middle East countries. Moreover, US officials have confirmed a fresh round of military action, including air strikes, against Iran-backed Houthi terrorist targets in Yemen. This further adds to the geopolitical tensions in the region, contributing to the overall volatility in energy markets.
Meanwhile, in Libya, the state-run National Oil Corporation has reported that the Sharara oilfield resumed operations on Sunday. This development brings back the supply of 270,000 barrels per day (bpd), contributing to 1 million bpd for the OPEC country.
In 2023, Russia emerged as the largest crude oil exporter to China, surpassing Saudi Arabia, despite Western sanctions to restrict Russian oil trade. According to Chinese customs data, Russia sold approximately 2.14 million barrels per day (bpd) of crude oil to China during the mentioned period.
Market participants will likely watch the upcoming Crude Oil Stock data closely, with the American Petroleum Institute (API) set to release its report for the week ending on January 19 on Tuesday. This will be followed by the Crude Oil Stocks Change data from the US Energy Information Administration (EIA) scheduled for Wednesday.
Technical Levels: Supports and Resistances
XTIUSD currently trading at 74.68 at the time of writing. Pair opened at 74.57 and is trading with a change of 0.15 % .
| Overview | Overview.1 | |
|---|---|---|
| 0 | Today last price | 74.68 |
| 1 | Today Daily Change | 0.11 |
| 2 | Today Daily Change % | 0.15 |
| 3 | Today daily open | 74.57 |
The pair is trading above its 20 Daily moving average @ 72.67, above its 50 Daily moving average @ 73.48 , below its 100 Daily moving average @ 79.42 and below its 200 Daily moving average @ 77.31
| Trends | Trends.1 | |
|---|---|---|
| 0 | Daily SMA20 | 72.67 |
| 1 | Daily SMA50 | 73.48 |
| 2 | Daily SMA100 | 79.42 |
| 3 | Daily SMA200 | 77.31 |
The previous day high was 75.43 while the previous day low was 72.55. The daily 38.2% Fib levels comes at 74.33, expected to provide support. Similarly, the daily 61.8% fib level is at 73.65, expected to provide support.
Note the levels of interest below:
- Pivot support is noted at 72.94, 71.31, 70.07
- Pivot resistance is noted at 75.82, 77.06, 78.69
| Levels | Levels.1 |
|---|---|
| Previous Daily High | 75.43 |
| Previous Daily Low | 72.55 |
| Previous Weekly High | 74.60 |
| Previous Weekly Low | 70.63 |
| Previous Monthly High | 76.79 |
| Previous Monthly Low | 67.97 |
| Daily Fibonacci 38.2% | 74.33 |
| Daily Fibonacci 61.8% | 73.65 |
| Daily Pivot Point S1 | 72.94 |
| Daily Pivot Point S2 | 71.31 |
| Daily Pivot Point S3 | 70.07 |
| Daily Pivot Point R1 | 75.82 |
| Daily Pivot Point R2 | 77.06 |
| Daily Pivot Point R3 | 78.69 |
[/s2If]
Nehcap Trading Strategies
The NEHCAP currently runs the following trading systems for clients. They can be bought and run on your funds.
The system is trading live: LIVE ACCOUNT TRACKING
Contact Us: Contact
The HFT_FIX can be run free for 2 weeks on any broker with a ECN. Apply for a free trial
Join Our Telegram Group
")


