WTI tested multi-week highs on Monday as market tensions rise. (Pivot Orderbook analysis)
…
This is a premium post.
[s2If !current_user_can(access_s2member_level4)]Please register for FREE REGISTER to read full post below containing analysis. In case of any error or you think you are not able to read the full post below, please email us at support#nehcap.com [lwa][/s2If] [s2If current_user_can(access_s2member_level1)]
- WTI tested multi-week highs on Monday as market tensions rise.
- Ukraine attacked a Russian fuel terminal, increasing market instability.
- Geopolitical risks continue to keep barrel prices on the high side.
The pair currently trades last at 74.64.
The previous day high was 74.6 while the previous day low was 72.98. The daily 38.2% Fib levels comes at 73.6, expected to provide support. Similarly, the daily 61.8% fib level is at 73.99, expected to provide support.
West Texas Intermediate (WTI) prices hit a one-month high of $75.42 on Monday after it was reported that Ukraine attacked a Russian fuel terminal using explosive drones, according to reporting by the BBC and the Wall Street Journal.
Global energy markets continue to get unnerved by the increasing potential for supply constraints as a successful Ukraine attack on Russian oil infrastructure highlights how easy it is to topple wide-reaching energy supply chains.
Between Ukraine targeting Russian energy infrastructure and Iran-backed Houthi rebels continuing to ramp up attacks on civilian cargo ships in the Red Sea, Crude Oil markets remain exposed to growing instability hobbling global trade if tensions continue to mount into a broader spill-over of multiple conflicts.
Despite ongoing geopolitical tensions and the risk they pose to Crude Oil supply, global production continues to keep prices capped after 2023’s fearful bids on the possibility of constrained energy markets failing to meet barrel demand bore almost no fruit.
2024 sees global oil production output and exporting continuing to climb despite hopeful production quotas from the Organization of the Petroleum Exporting Countries (OPEC) getting undercut by US Crude Oil production rising into historical highs.
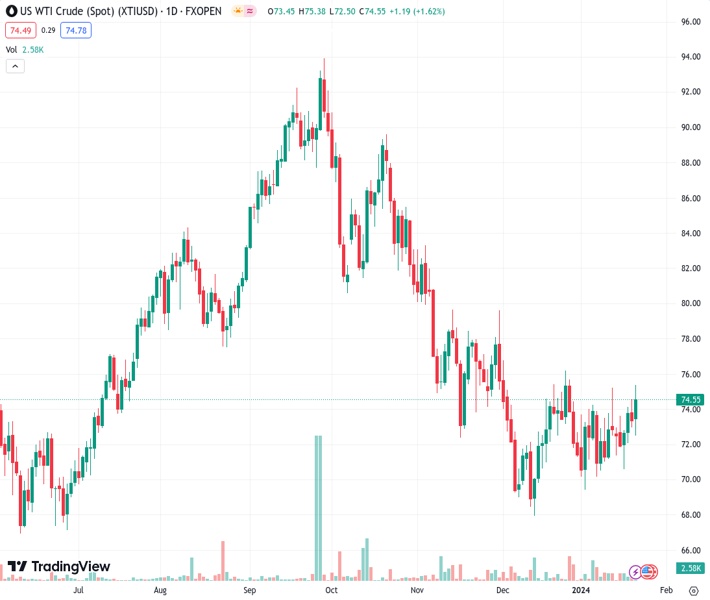
WTI climbed nearly 4% bottom-to-top on Monday, rising from $72.55 to test into $75.42, settling back into $74.64 as markets head into the Tuesday market session.
US Crude Oil is caught in a congestion zone between the 50-day and 200-day Simple Moving Averages (SMA) between $78.00 and $73.00, trading into a tight consolidation range after slumping through the 200-day SMA in November.
Technical Levels: Supports and Resistances
XTIUSD currently trading at 74.64 at the time of writing. Pair opened at 73.6 and is trading with a change of 1.41 % .
| Overview | Overview.1 | |
|---|---|---|
| 0 | Today last price | 74.64 |
| 1 | Today Daily Change | 1.04 |
| 2 | Today Daily Change % | 1.41 |
| 3 | Today daily open | 73.60 |
The pair is trading above its 20 Daily moving average @ 72.62, above its 50 Daily moving average @ 73.56 , below its 100 Daily moving average @ 79.53 and below its 200 Daily moving average @ 77.34
| Trends | Trends.1 | |
|---|---|---|
| 0 | Daily SMA20 | 72.62 |
| 1 | Daily SMA50 | 73.56 |
| 2 | Daily SMA100 | 79.53 |
| 3 | Daily SMA200 | 77.34 |
The previous day high was 74.6 while the previous day low was 72.98. The daily 38.2% Fib levels comes at 73.6, expected to provide support. Similarly, the daily 61.8% fib level is at 73.99, expected to provide support.
Note the levels of interest below:
- Pivot support is noted at 72.85, 72.11, 71.23
- Pivot resistance is noted at 74.47, 75.35, 76.09
| Levels | Levels.1 |
|---|---|
| Previous Daily High | 74.60 |
| Previous Daily Low | 72.98 |
| Previous Weekly High | 74.60 |
| Previous Weekly Low | 70.63 |
| Previous Monthly High | 76.79 |
| Previous Monthly Low | 67.97 |
| Daily Fibonacci 38.2% | 73.60 |
| Daily Fibonacci 61.8% | 73.99 |
| Daily Pivot Point S1 | 72.85 |
| Daily Pivot Point S2 | 72.11 |
| Daily Pivot Point S3 | 71.23 |
| Daily Pivot Point R1 | 74.47 |
| Daily Pivot Point R2 | 75.35 |
| Daily Pivot Point R3 | 76.09 |
[/s2If]
Nehcap Trading Strategies
The NEHCAP currently runs the following trading systems for clients. They can be bought and run on your funds.
The system is trading live: LIVE ACCOUNT TRACKING
Contact Us: Contact
The HFT_FIX can be run free for 2 weeks on any broker with a ECN. Apply for a free trial
Join Our Telegram Group
")


