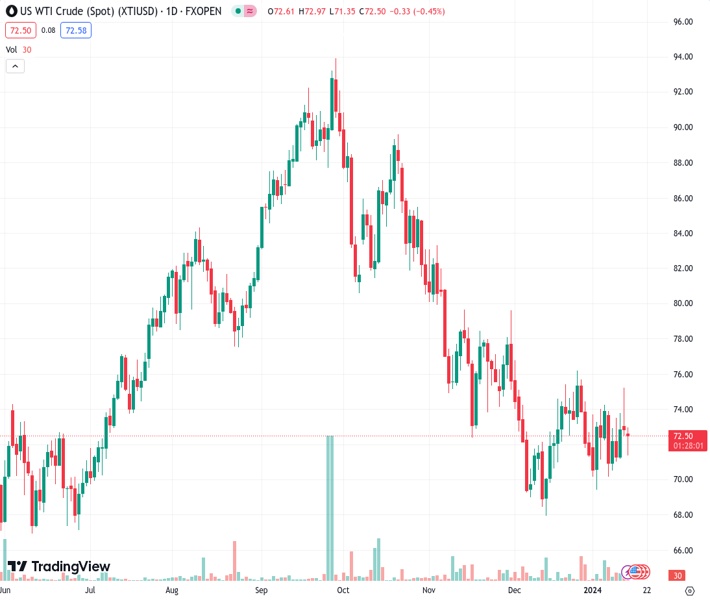
WTI cycles in red territory on Monday, stuck near $72.50. (Pivot Orderbook analysis)
…
This is a premium post.
[s2If !current_user_can(access_s2member_level4)]Please register for FREE REGISTER to read full post below containing analysis. In case of any error or you think you are not able to read the full post below, please email us at support#nehcap.com [lwa][/s2If] [s2If current_user_can(access_s2member_level1)]
- WTI cycles in red territory on Monday, stuck near $72.50.
- Crude Oil fundamentals continue to soften, global production continues unabated.
- Houthi rebels continue to hamper supply lines between Europe and Asia.
The pair currently trades last at 72.55.
The previous day high was 75.28 while the previous day low was 72.48. The daily 38.2% Fib levels comes at 74.21, expected to provide resistance. Similarly, the daily 61.8% fib level is at 73.55, expected to provide resistance.
West Texas Intermediate (WTI) US Crude Oil saw weakness in early Monday trading, falling to a near-term low of $71.40 before rebounding to $72.50 following a fresh rocket attack on a civilian cargo ship by Iran-backed Houthi rebels in Yemen. The Houthis, a religious extremist organization with strong ties to Tehran, who recognize the Houthis as the official Yemeni government.
Ongoing energy market concerns continue to fret about potential supply chain disruptions, and the potential for production cuts from the Organization of the Petroleum Exporting Countries to take a bite out of global energy markets’ ability to meet fossil fuel demand, but record Crude Oil production from key non-OPEC countries such as the US and a massive buildup in petroleum gasoline and other Crude Oil derivatives are hampering barrel traders’ efforts to drive up Crude Oil costs.
The American Petroleum Institute (API) will be delivering their latest Weekly Crude Oil Stock counts for the week ended January 12th on Wednesday, followed by the Energy Information Administration’s (EIA) Natural Gas Storage and Crude Oil Stocks Change on Thursday.
US Crude Oil has seen rough intraday trading in 2024, with barrel prices cycling in a rough channel between $74.00 and $70.50 as near-term price action sticks close to the 200-hour Simple Moving Average (SMA) near $72.50.
Daily candlesticks have WTI consolidating on the south side of the 200-day SMA at the $78.00 handle, with a descending 50-day SMA building out a technical ceiling and applying downside pressure to near-term price action from $74.00.
Technical Levels: Supports and Resistances
XTIUSD currently trading at 72.55 at the time of writing. Pair opened at 72.85 and is trading with a change of -0.41 % .
| Overview | Overview.1 | |
|---|---|---|
| 0 | Today last price | 72.55 |
| 1 | Today Daily Change | -0.30 |
| 2 | Today Daily Change % | -0.41 |
| 3 | Today daily open | 72.85 |
The pair remains strongly bearish on the daily time frame. It trades below the 20 SMA @ 72.83, 50 SMA 74.0, 100 SMA @ 80.0 and 200 SMA @ 77.56.
| Trends | Trends.1 | |
|---|---|---|
| 0 | Daily SMA20 | 72.83 |
| 1 | Daily SMA50 | 74.00 |
| 2 | Daily SMA100 | 80.00 |
| 3 | Daily SMA200 | 77.56 |
The previous day high was 75.28 while the previous day low was 72.48. The daily 38.2% Fib levels comes at 74.21, expected to provide resistance. Similarly, the daily 61.8% fib level is at 73.55, expected to provide resistance.
Note the levels of interest below:
- Pivot support is noted at 71.79, 70.74, 68.99
- Pivot resistance is noted at 74.59, 76.34, 77.39
| Levels | Levels.1 |
|---|---|
| Previous Daily High | 75.28 |
| Previous Daily Low | 72.48 |
| Previous Weekly High | 75.28 |
| Previous Weekly Low | 70.21 |
| Previous Monthly High | 76.79 |
| Previous Monthly Low | 67.97 |
| Daily Fibonacci 38.2% | 74.21 |
| Daily Fibonacci 61.8% | 73.55 |
| Daily Pivot Point S1 | 71.79 |
| Daily Pivot Point S2 | 70.74 |
| Daily Pivot Point S3 | 68.99 |
| Daily Pivot Point R1 | 74.59 |
| Daily Pivot Point R2 | 76.34 |
| Daily Pivot Point R3 | 77.39 |
[/s2If]
Nehcap Trading Strategies
The NEHCAP currently runs the following trading systems for clients. They can be bought and run on your funds.
The system is trading live: LIVE ACCOUNT TRACKING
Contact Us: Contact
The HFT_FIX can be run free for 2 weeks on any broker with a ECN. Apply for a free trial
Join Our Telegram Group
")


