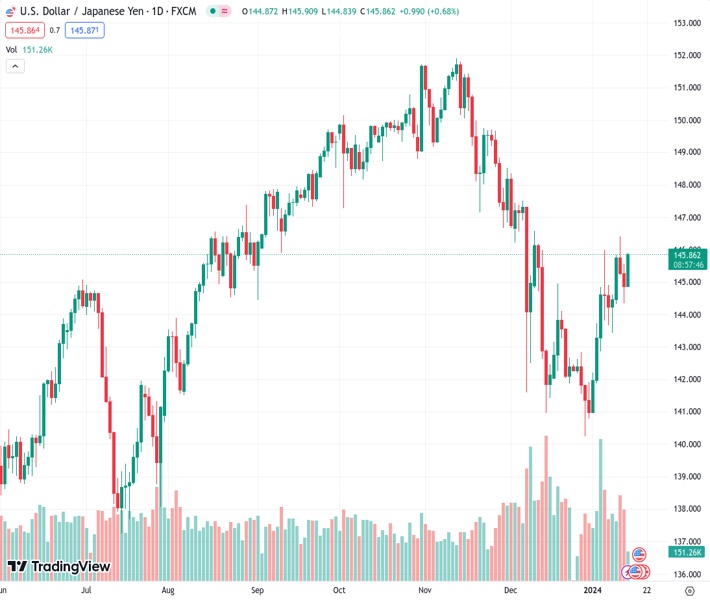
#USDJPY @ 145.845 The Greenback’s recovery accelerates as market sentiment fades. (Pivot Orderbook analysis)
…
This is a premium post.
[s2If !current_user_can(access_s2member_level4)]Please register for FREE REGISTER to read full post below containing analysis. In case of any error or you think you are not able to read the full post below, please email us at support#nehcap.com [lwa][/s2If] [s2If current_user_can(access_s2member_level1)]
- The Greenback’s recovery accelerates as market sentiment fades.
- The Yen is on the defensive on hopes that the BoJ will keep its ultra-loose policy unchanged.
- Markets are calm today with US markets closed on bank holiday.
The pair currently trades last at 145.845.
The previous day high was 145.57 while the previous day low was 144.35. The daily 38.2% Fib levels comes at 144.82, expected to provide support. Similarly, the daily 61.8% fib level is at 145.1, expected to provide support.
The US Dollar bounced higher on Monday, favoured by sourer market sentiment and a weaker Japanese Yen. The pair has regained most of the ground lost on Friday and reaching Intra-day highs nearing 146.00.
The Greenback seems to have shrugged off the post-US PPI weakness in a calm trading session, with US markets closed for the Martin Luther King birthday.
With the Bank of Japan monetary policy meeting approaching, the weak Tokyo CPI index and wage data seen last week have practically discarded any monetary policy normalization in January’s meeting. This is likely to keep the Yemn on the defensive this week.
The calendar is light today with only the NY Empire State Manufacturing Index. The Highlight in the US calendar will be the Retail Sales release on Wednesday. In Japan, all eyes are on the National CPI data due on Thursday. The risk of this event is negative for the Yen.
Technical indicators are pointing higher, with bulls aiming for Thursday’s high at 146.40 ahead of 147.45. Immediate support is at 144.35 and then 143.55.
Technical Levels: Supports and Resistances
USDJPY currently trading at 145.87 at the time of writing. Pair opened at 144.9 and is trading with a change of 0.67 % .
| Overview | Overview.1 | |
|---|---|---|
| 0 | Today last price | 145.87 |
| 1 | Today Daily Change | 0.97 |
| 2 | Today Daily Change % | 0.67 |
| 3 | Today daily open | 144.90 |
The pair is trading above its 20 Daily moving average @ 143.23, below its 50 Daily moving average @ 146.12 , below its 100 Daily moving average @ 147.38 and above its 200 Daily moving average @ 143.63
| Trends | Trends.1 | |
|---|---|---|
| 0 | Daily SMA20 | 143.23 |
| 1 | Daily SMA50 | 146.12 |
| 2 | Daily SMA100 | 147.38 |
| 3 | Daily SMA200 | 143.63 |
The previous day high was 145.57 while the previous day low was 144.35. The daily 38.2% Fib levels comes at 144.82, expected to provide support. Similarly, the daily 61.8% fib level is at 145.1, expected to provide support.
Note the levels of interest below:
- Pivot support is noted at 144.31, 143.72, 143.09
- Pivot resistance is noted at 145.53, 146.16, 146.74
| Levels | Levels.1 |
|---|---|
| Previous Daily High | 145.57 |
| Previous Daily Low | 144.35 |
| Previous Weekly High | 146.41 |
| Previous Weekly Low | 143.42 |
| Previous Monthly High | 148.35 |
| Previous Monthly Low | 140.25 |
| Daily Fibonacci 38.2% | 144.82 |
| Daily Fibonacci 61.8% | 145.10 |
| Daily Pivot Point S1 | 144.31 |
| Daily Pivot Point S2 | 143.72 |
| Daily Pivot Point S3 | 143.09 |
| Daily Pivot Point R1 | 145.53 |
| Daily Pivot Point R2 | 146.16 |
| Daily Pivot Point R3 | 146.74 |
[/s2If]
Nehcap Trading Strategies
The NEHCAP currently runs the following trading systems for clients. They can be bought and run on your funds.
The system is trading live: LIVE ACCOUNT TRACKING
Contact Us: Contact
The HFT_FIX can be run free for 2 weeks on any broker with a ECN. Apply for a free trial
Join Our Telegram Group
")


