#USDJPY @ 145.781 ‘s ascent influenced by a stronger Dollar, with DXY up 0.15%, and market focus on Fed’s monetary policy trajectory. (Pivot Orderbook analysis)
…
This is a premium post.
[s2If !current_user_can(access_s2member_level4)]Please register for FREE REGISTER to read full post below containing analysis. In case of any error or you think you are not able to read the full post below, please email us at support#nehcap.com [lwa][/s2If] [s2If current_user_can(access_s2member_level1)]
- USD/JPY’s ascent influenced by a stronger Dollar, with DXY up 0.15%, and market focus on Fed’s monetary policy trajectory.
- Market estimates of significant Fed rate cuts in 2024 drive currency dynamics despite recent US inflation data.
- Upcoming Japanese and US economic releases, including Japan’s PPI and the NY Fed Manufacturing Index, to provide further insights
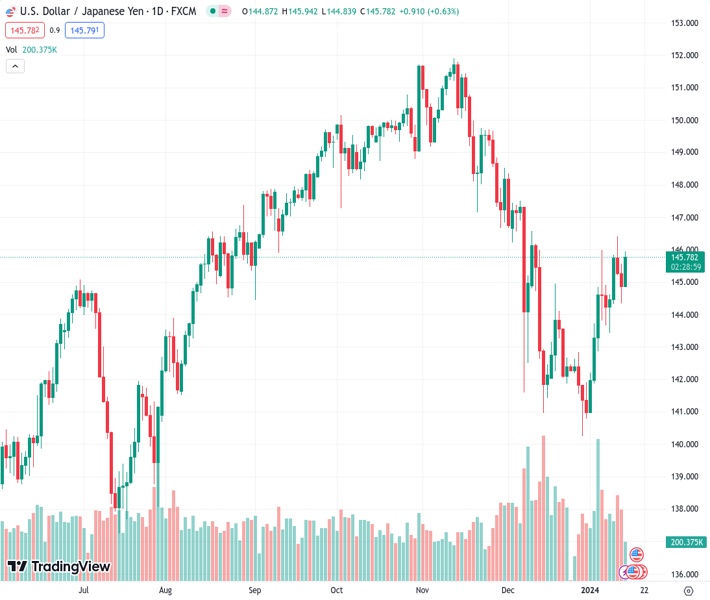
The pair currently trades last at 145.781.
The previous day high was 145.57 while the previous day low was 144.35. The daily 38.2% Fib levels comes at 144.82, expected to provide support. Similarly, the daily 61.8% fib level is at 145.1, expected to provide support.
The USD/JPY climbed late in the North American session on Monday amid low volume conditions as the United States (US) financial markets remained closed on Martin Luther King Day. Despite that, the Greenback (USD) remains strong across the board, as the USD/JPY exchanges hands at 145.79, up by 0.63%.
As mentioned above, the US Dollar Index (DXY); a gauge of the buck’s performance against a basket of six currencies including the Japanese Yen (JPY) climbs 0.15%, at 102.58, a tailwind for the USD/JPY. The lack of economic data released on the day keeps traders entertained with the Federal Reserve’s (Fed) prospects to relax monetary conditions via the Chicago Board of Trade (COT).
Interest rates market participants estimate the US Central Bank would cut rates by more than 170 basis points in the year, even though consumer prices rose above estimates and the prior readings. That was overshadowed by last Friday’s Producer Price Index (PPI), which witnessed an increase of more than 80% odds for a 25 bps cut in March.
Aside from this, the Japanese economic docket would feature the Producer Price Index for December, which is expected to show some deceleration, alongside the Reuters Tankan Index on Tuesday. On the US front, the economic docket would feature the New York Fed Empire State Manufacturing Index and a speech by US Federal Reserve Governor Christopher Waller. That comes ahead of Wednesday’s Retail Sales and Industrial Production.
The daily chart portrays the pair at the brisk of shifting bullish, as the USD/JPY spot price is near the bottom of the Ichimoku Cloud (Kumo). A breach above the 146.00 figure and the Senkou Span B at 146.07 could pave the way for further upside at the top of the Kumo at 146.77, followed by the 147.00 figure. Once surpassed, the next resistance would emerge at 148.00. On the opposite front, sellers need to drag prices below the January 12 low of 144.34, which could pave the way toward 144.00, but firstly, it would face the Tenkan-Sen at 144.13.
Technical Levels: Supports and Resistances
USDJPY currently trading at 145.78 at the time of writing. Pair opened at 144.9 and is trading with a change of 0.61 % .
| Overview | Overview.1 | |
|---|---|---|
| 0 | Today last price | 145.78 |
| 1 | Today Daily Change | 0.88 |
| 2 | Today Daily Change % | 0.61 |
| 3 | Today daily open | 144.90 |
The pair is trading above its 20 Daily moving average @ 143.23, below its 50 Daily moving average @ 146.12 , below its 100 Daily moving average @ 147.38 and above its 200 Daily moving average @ 143.63
| Trends | Trends.1 | |
|---|---|---|
| 0 | Daily SMA20 | 143.23 |
| 1 | Daily SMA50 | 146.12 |
| 2 | Daily SMA100 | 147.38 |
| 3 | Daily SMA200 | 143.63 |
The previous day high was 145.57 while the previous day low was 144.35. The daily 38.2% Fib levels comes at 144.82, expected to provide support. Similarly, the daily 61.8% fib level is at 145.1, expected to provide support.
Note the levels of interest below:
- Pivot support is noted at 144.31, 143.72, 143.09
- Pivot resistance is noted at 145.53, 146.16, 146.74
| Levels | Levels.1 |
|---|---|
| Previous Daily High | 145.57 |
| Previous Daily Low | 144.35 |
| Previous Weekly High | 146.41 |
| Previous Weekly Low | 143.42 |
| Previous Monthly High | 148.35 |
| Previous Monthly Low | 140.25 |
| Daily Fibonacci 38.2% | 144.82 |
| Daily Fibonacci 61.8% | 145.10 |
| Daily Pivot Point S1 | 144.31 |
| Daily Pivot Point S2 | 143.72 |
| Daily Pivot Point S3 | 143.09 |
| Daily Pivot Point R1 | 145.53 |
| Daily Pivot Point R2 | 146.16 |
| Daily Pivot Point R3 | 146.74 |
[/s2If]
Nehcap Trading Strategies
The NEHCAP currently runs the following trading systems for clients. They can be bought and run on your funds.
The system is trading live: LIVE ACCOUNT TRACKING
Contact Us: Contact
The HFT_FIX can be run free for 2 weeks on any broker with a ECN. Apply for a free trial
Join Our Telegram Group
")


