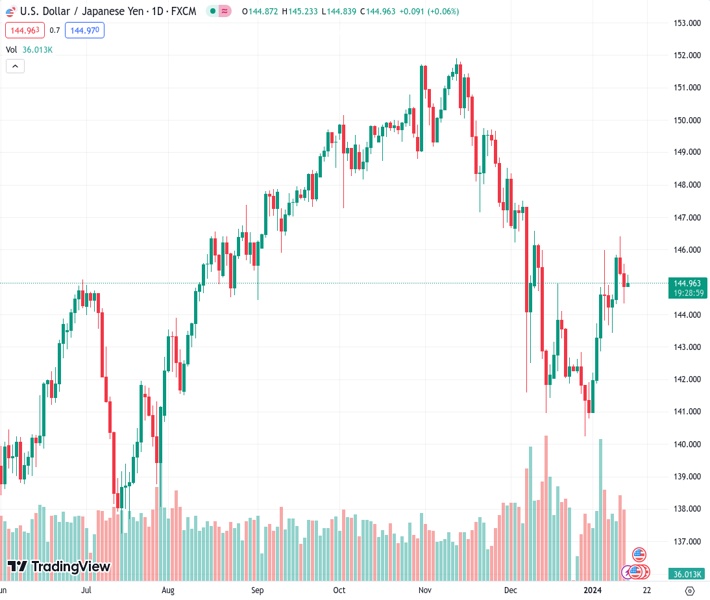
#USDJPY @ 144.968 snaps a two-day losing streak near 145.00 on Monday. (Pivot Orderbook analysis)
…
This is a premium post.
[s2If !current_user_can(access_s2member_level4)]Please register for FREE REGISTER to read full post below containing analysis. In case of any error or you think you are not able to read the full post below, please email us at support#nehcap.com [lwa][/s2If] [s2If current_user_can(access_s2member_level1)]
- USD/JPY snaps a two-day losing streak near 145.00 on Monday.
- The downbeat US PPI has triggered the possibility that the Federal Reserve (Fed) will start cutting interest rates this year.
- Japan’s two-year yield has declined back under zero for the first time since July 2023.
The pair currently trades last at 144.968.
The previous day high was 145.57 while the previous day low was 144.35. The daily 38.2% Fib levels comes at 144.82, expected to provide support. Similarly, the daily 61.8% fib level is at 145.1, expected to provide resistance.
The USD/JPY pair gained traction above the 145.00 mark during the early Asian session on Monday. The pair rebounds despite the decline of the US Dollar (USD). The market is likely to have a quiet session amid the US bank holiday. At press time, USD/JPY is trading at 145.06, up 0.12% for the day.
The US Producer Price Index (PPI) unexpectedly fell in December, raising the possibility that the Federal Reserve (Fed) would start cutting interest rates this year. The market has priced in 86% odds of a rate cut by March, with the overall 2024 easing cycle priced at around 166 basis points (bps), compared to 75 bps projected by the Fed dot plot. This, in turn, might cap the upside of the Greenback and act as a headwind for the USD/JPY pair.
Japan’s two-year yield has dropped back under zero for the first time since July 2023. On Friday, the report said the Bank of Japan (BOJ) is likely to cut its core inflation forecast for the fiscal year 2024 (currently 2.8%) amid the recent decline in oil prices. Additionally, the BOJ is expected to maintain its projection that trend inflation will stay near its 2% target in the coming years, despite global economic uncertainty and lacklustre spending. The projection will be part of the bank’s quarterly outlook report due at its next rate review on January 22–23. The BoJ board is widely expected to keep ultra-loose policy settings unchanged.
Looking ahead, the Japanese Machine Tool Orders are due on Monday. However, this low-tier data might not impact the market. Later this week, the Japanese Producer Price Index and the US NY Empire State Manufacturing Index will be released on Tuesday. The US Retail Sales will be due on Wednesday. Traders will take cues from these figures and find trading opportunities around the USD/JPY pair.
Technical Levels: Supports and Resistances
USDJPY currently trading at 145.02 at the time of writing. Pair opened at 144.9 and is trading with a change of 0.08 % .
| Overview | Overview.1 | |
|---|---|---|
| 0 | Today last price | 145.02 |
| 1 | Today Daily Change | 0.12 |
| 2 | Today Daily Change % | 0.08 |
| 3 | Today daily open | 144.90 |
The pair is trading above its 20 Daily moving average @ 143.23, below its 50 Daily moving average @ 146.12 , below its 100 Daily moving average @ 147.38 and above its 200 Daily moving average @ 143.63
| Trends | Trends.1 | |
|---|---|---|
| 0 | Daily SMA20 | 143.23 |
| 1 | Daily SMA50 | 146.12 |
| 2 | Daily SMA100 | 147.38 |
| 3 | Daily SMA200 | 143.63 |
The previous day high was 145.57 while the previous day low was 144.35. The daily 38.2% Fib levels comes at 144.82, expected to provide support. Similarly, the daily 61.8% fib level is at 145.1, expected to provide resistance.
Note the levels of interest below:
- Pivot support is noted at 144.31, 143.72, 143.09
- Pivot resistance is noted at 145.53, 146.16, 146.74
| Levels | Levels.1 |
|---|---|
| Previous Daily High | 145.57 |
| Previous Daily Low | 144.35 |
| Previous Weekly High | 146.41 |
| Previous Weekly Low | 143.42 |
| Previous Monthly High | 148.35 |
| Previous Monthly Low | 140.25 |
| Daily Fibonacci 38.2% | 144.82 |
| Daily Fibonacci 61.8% | 145.10 |
| Daily Pivot Point S1 | 144.31 |
| Daily Pivot Point S2 | 143.72 |
| Daily Pivot Point S3 | 143.09 |
| Daily Pivot Point R1 | 145.53 |
| Daily Pivot Point R2 | 146.16 |
| Daily Pivot Point R3 | 146.74 |
[/s2If]
Nehcap Trading Strategies
The NEHCAP currently runs the following trading systems for clients. They can be bought and run on your funds.
The system is trading live: LIVE ACCOUNT TRACKING
Contact Us: Contact
The HFT_FIX can be run free for 2 weeks on any broker with a ECN. Apply for a free trial
Join Our Telegram Group
")


