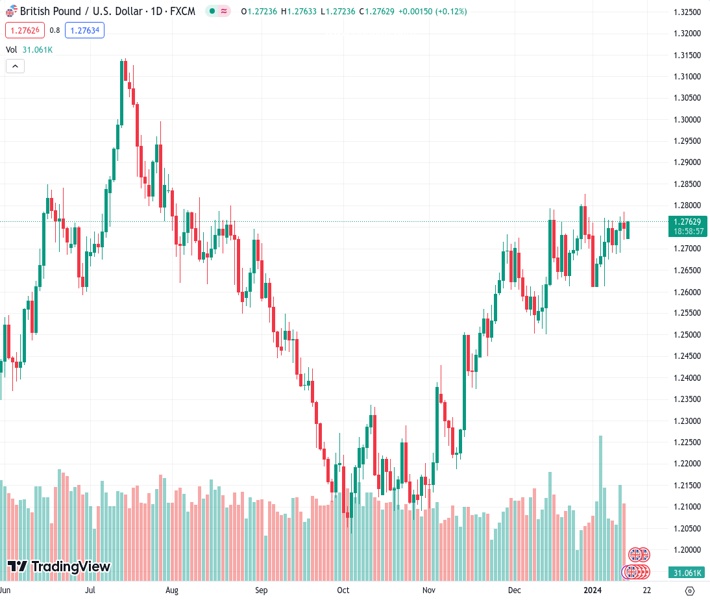
#GBPUSD @ 1.27623 recovers its intraday losses on the weaker US Dollar. (Pivot Orderbook analysis)
…
This is a premium post.
[s2If !current_user_can(access_s2member_level4)]Please register for FREE REGISTER to read full post below containing analysis. In case of any error or you think you are not able to read the full post below, please email us at support#nehcap.com [lwa][/s2If] [s2If current_user_can(access_s2member_level1)]
- GBP/USD recovers its intraday losses on the weaker US Dollar.
- The risk-on mood fades on escalated tension in the Middle East.
- Barclays revised its forecast on the Fed rate cut to March from June.
The pair currently trades last at 1.27623.
The previous day high was 1.2786 while the previous day low was 1.272. The daily 38.2% Fib levels comes at 1.2745, expected to provide support. Similarly, the daily 61.8% fib level is at 1.2761, expected to provide support.
The GBP/USD treads water near 1.2760 during the European session on Monday, recovering intraday losses as the US Dollar (USD) loses ground on the weaker US bond yields, coupled with the softer Producer Price Index (PPI) data from United States (US). The heightened tension in the Middle East has balanced the risk-on sentiment, particularly following military attacks on Iran-led Houthi targets, conducted by the United States (US) and the United Kingdom (UK) on Friday. This geopolitical development has influenced both the USD’s strength and the overall sentiment in the GBP/USD pair.
The US Dollar Index (DXY) trims its intraday gains due to the decline in the US Treasury yields. The 2-year and 10-year yields on US bond coupons stand lower at 4.14% and 3.94%, respectively, by the press time. The increased market speculation regarding potential rate cuts by the US Federal Reserve (Fed) in March has exerted pressure on US yields. This speculation gained momentum, particularly after Barclays revised its forecast on Friday for the first Federal Reserve rate cut, advancing it to March from June.
Moreover, the softer-than-expected Producer Price Index (PPI) data released on Friday might have exerted downward pressure on the US Dollar. According to the US Bureau of Labor Statistics, the December Producer Price Index (PPI) figure was 1.0% year-on-year, compared to the previous reading of 0.8%. The Core PPI year-on-year arrived at 1.8%, down from 2.0% in November. On a monthly basis, both the headline and Core PPI indices remained at 0.1% decline and 0.0%, respectively.
The GBP/USD pair might have gained some ground on on improved production data from the United Kingdom (UK) released on Friday. In November, the United Kingdom’s (UK) industrial sector activity rebounded, according to data from the Office for National Statistics (ONS) released on Friday. Total Industrial Production (MoM) remained consistent in line with expectations and contrasted with the previous decline. On an annual basis, UK Manufacturing Production increased in November. However, Total Industrial Output declined by 0.1% in the same period.
Additionally, on Monday, January’s Rightmove House Price Index (MoM) improved by 1.3% against the previous decline of 1.9%. While the year-over-year eased at a 0.7% decline against December’s decline of 1.1%. Traders will likely observe the labor market data including Claimant Count Change and ILO Unemployment Rate (3M).
Technical Levels: Supports and Resistances
GBPUSD currently trading at 1.2756 at the time of writing. Pair opened at 1.2745 and is trading with a change of 0.09 % .
| Overview | Overview.1 | |
|---|---|---|
| 0 | Today last price | 1.2756 |
| 1 | Today Daily Change | 0.0011 |
| 2 | Today Daily Change % | 0.0900 |
| 3 | Today daily open | 1.2745 |
The pair remains strongly bullish on the daily timeframe. It trades above its 20 SMA @ 1.271, 50 SMA 1.2596, 100 SMA @ 1.2451 and 200 SMA @ 1.2545.
| Trends | Trends.1 | |
|---|---|---|
| 0 | Daily SMA20 | 1.2710 |
| 1 | Daily SMA50 | 1.2596 |
| 2 | Daily SMA100 | 1.2451 |
| 3 | Daily SMA200 | 1.2545 |
The previous day high was 1.2786 while the previous day low was 1.272. The daily 38.2% Fib levels comes at 1.2745, expected to provide support. Similarly, the daily 61.8% fib level is at 1.2761, expected to provide support.
Note the levels of interest below:
- Pivot support is noted at 1.2714, 1.2684, 1.2648
- Pivot resistance is noted at 1.2781, 1.2816, 1.2847
| Levels | Levels.1 |
|---|---|
| Previous Daily High | 1.2786 |
| Previous Daily Low | 1.2720 |
| Previous Weekly High | 1.2786 |
| Previous Weekly Low | 1.2674 |
| Previous Monthly High | 1.2828 |
| Previous Monthly Low | 1.2501 |
| Daily Fibonacci 38.2% | 1.2745 |
| Daily Fibonacci 61.8% | 1.2761 |
| Daily Pivot Point S1 | 1.2714 |
| Daily Pivot Point S2 | 1.2684 |
| Daily Pivot Point S3 | 1.2648 |
| Daily Pivot Point R1 | 1.2781 |
| Daily Pivot Point R2 | 1.2816 |
| Daily Pivot Point R3 | 1.2847 |
[/s2If]
Nehcap Trading Strategies
The NEHCAP currently runs the following trading systems for clients. They can be bought and run on your funds.
The system is trading live: LIVE ACCOUNT TRACKING
Contact Us: Contact
The HFT_FIX can be run free for 2 weeks on any broker with a ECN. Apply for a free trial
Join Our Telegram Group
")


