#GBPUSD @ 1.27272 slips back once again on Monday, dips into 1.2715. (Pivot Orderbook analysis)
…
This is a premium post.
[s2If !current_user_can(access_s2member_level4)]Please register for FREE REGISTER to read full post below containing analysis. In case of any error or you think you are not able to read the full post below, please email us at support#nehcap.com [lwa][/s2If] [s2If current_user_can(access_s2member_level1)]
- GBP/USD slips back once again on Monday, dips into 1.2715.
- UK labor figures due on Tuesday.
- BoE Governor Bailey to testify on state of economy before UK Parliament.
The pair currently trades last at 1.27272.
The previous day high was 1.2786 while the previous day low was 1.272. The daily 38.2% Fib levels comes at 1.2745, expected to provide resistance. Similarly, the daily 61.8% fib level is at 1.2761, expected to provide resistance.
The GBP/USD fell back once more on Monday, testing 1.2715 after a short-lived rally at the Modnay open reversed course. The Pound Sterling (GBP) couldn’t get over 1.2765 against the US Dollar (USD), sliding 0.4% peak-to-trough before consolidating in holiday-thinned market volumes during the US extended weekend in observance of Martin Luther King Day.
The UK’s Rightmove House Price Index rose 1.3% in January, compared to December’s -1.9%, while the annualized figure declined 0.7%, rebounding slightly from the previous period’s -1.1%. The MoM is a firm rebound in the headline figure, but still well below last May’s near-term peak of 1.8%.
Up next will be Tuesday’s UK Claimant Count Change, ILO Unemployment Rate, and Average Earnings for the annualized quarter ended in November.
December’s Claimant Count Change printed at 16K, while the ILO quarterly Unemployment Rate is forecast to hold steady at 4.2%. UK Average Earnings growth is expected to decline both with and without bonuses factored in, with Average Earnings Excluding Bonuses for the quarter through November expected to tick back from 7.3% to 6.6%.
Bank of England (BoE) Governor Andrew Bailey will be testifying before the Lords’ Economic Affairs Committee in London before departing to attend the World Economic Forum in Davos, Switzerland.
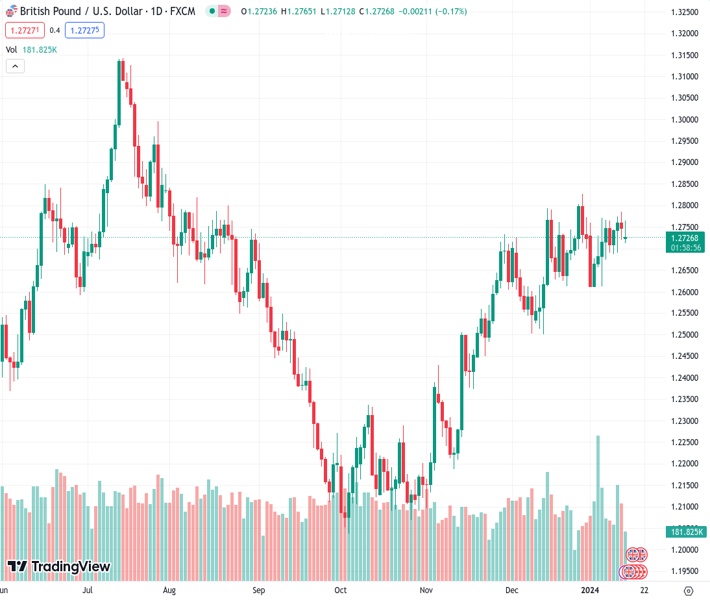
The GBP/USD is caught in a near-term sideways grind, with intraday prices getting caught up on the 200-hour Simple Moving Average (SMA) near 1.2720, while 1.2780 is proving to be a tricky technical ceiling for the pair to overcome.
Despite the pair stuck on the low side of the 1.2800 handle near December’s peak, the pair remains on the high end of momentum on daily candles, with the pair up 5.75% from October’s swing low of 1.2037.
Technical Levels: Supports and Resistances
GBPUSD currently trading at 1.2729 at the time of writing. Pair opened at 1.2745 and is trading with a change of -0.13 % .
| Overview | Overview.1 | |
|---|---|---|
| 0 | Today last price | 1.2729 |
| 1 | Today Daily Change | -0.0016 |
| 2 | Today Daily Change % | -0.1300 |
| 3 | Today daily open | 1.2745 |
The pair remains strongly bullish on the daily timeframe. It trades above its 20 SMA @ 1.271, 50 SMA 1.2596, 100 SMA @ 1.2451 and 200 SMA @ 1.2545.
| Trends | Trends.1 | |
|---|---|---|
| 0 | Daily SMA20 | 1.2710 |
| 1 | Daily SMA50 | 1.2596 |
| 2 | Daily SMA100 | 1.2451 |
| 3 | Daily SMA200 | 1.2545 |
The previous day high was 1.2786 while the previous day low was 1.272. The daily 38.2% Fib levels comes at 1.2745, expected to provide resistance. Similarly, the daily 61.8% fib level is at 1.2761, expected to provide resistance.
Note the levels of interest below:
- Pivot support is noted at 1.2714, 1.2684, 1.2648
- Pivot resistance is noted at 1.2781, 1.2816, 1.2847
| Levels | Levels.1 |
|---|---|
| Previous Daily High | 1.2786 |
| Previous Daily Low | 1.2720 |
| Previous Weekly High | 1.2786 |
| Previous Weekly Low | 1.2674 |
| Previous Monthly High | 1.2828 |
| Previous Monthly Low | 1.2501 |
| Daily Fibonacci 38.2% | 1.2745 |
| Daily Fibonacci 61.8% | 1.2761 |
| Daily Pivot Point S1 | 1.2714 |
| Daily Pivot Point S2 | 1.2684 |
| Daily Pivot Point S3 | 1.2648 |
| Daily Pivot Point R1 | 1.2781 |
| Daily Pivot Point R2 | 1.2816 |
| Daily Pivot Point R3 | 1.2847 |
[/s2If]
Nehcap Trading Strategies
The NEHCAP currently runs the following trading systems for clients. They can be bought and run on your funds.
The system is trading live: LIVE ACCOUNT TRACKING
Contact Us: Contact
The HFT_FIX can be run free for 2 weeks on any broker with a ECN. Apply for a free trial
Join Our Telegram Group
")


