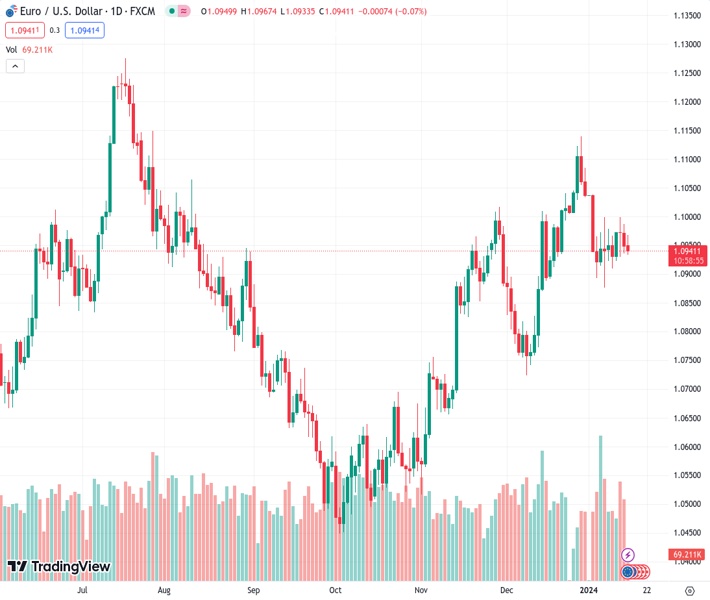
#EURUSD @ 1.09408 slips to near 1.0940 as investors’ risk-appetite eases amid long-weekend-induced volatility. (Pivot Orderbook analysis)
…
This is a premium post.
[s2If !current_user_can(access_s2member_level4)]Please register for FREE REGISTER to read full post below containing analysis. In case of any error or you think you are not able to read the full post below, please email us at support#nehcap.com [lwa][/s2If] [s2If current_user_can(access_s2member_level1)]
- EUR/USD slips to near 1.0940 as investors’ risk-appetite eases amid long-weekend-induced volatility.
- The USD Index has rebounded sharply to near 102.60 despite persistent Fed rate-cut bets.
- German real Q4 GDP contracted by 0.3% as expected.
The pair currently trades last at 1.09408.
The previous day high was 1.0987 while the previous day low was 1.0936. The daily 38.2% Fib levels comes at 1.0955, expected to provide resistance. Similarly, the daily 61.8% fib level is at 1.0967, expected to provide resistance.
The EUR/USD pair falls to near 1.0940 in the European session. The major currency pair has faced selling pressure as the US Dollar Index (DXY) has recovered in a thin-volume trading session. Investors’ risk-appetite has trimmed amid volatility-induced by extended weekend in the United States on account of Martin Luther King Birthday.
S&P500 futures have witnessed some losses in the London session, indicating a risk-averse market mood. The USD index has recovered sharply 102.60 as investors see other central banks following Federal Reserve’s (Fed) path of rate cuts.
After the Fed, investors see other central banks also reducing interest rates due to easing price pressures and deepening risks of a technical recession. Unlike the Eurozone and the United Kingdom, the US economy is resilient on the grounds of Gross Domestic Product (GDP) growth, consumer spending, and labor market.
Meanwhile, investors await the US monthly Retail Sales data for December, which will be published on Thursday. As per the consensus, the economic data grew by 0.4% against 0.3% increase in November.
The USD Index will continue to be guided majorly by perception towards rate cuts by the Fed. As per the CME Fedwatch tool, traders see a 70% chance in support of rate cut by the Fed in March.
On the Eurozone front, the preliminary GDP of Germany has contracted by 0.3% in the fourth-quarter of 2023 as anticipated. Previously, the German economy grew by 1.8%.
While investors see the European Central Bank (ECB) reducing interest rates sooner, ECB Chief economist Philip Lane has commented that interest rate cut is not a near-term debate considering recent inflation data.
Technical Levels: Supports and Resistances
EURUSD currently trading at 1.0936 at the time of writing. Pair opened at 1.0951 and is trading with a change of -0.14 % .
| Overview | Overview.1 | |
|---|---|---|
| 0 | Today last price | 1.0936 |
| 1 | Today Daily Change | -0.0015 |
| 2 | Today Daily Change % | -0.1400 |
| 3 | Today daily open | 1.0951 |
The pair is trading below its 20 Daily moving average @ 1.0984, above its 50 Daily moving average @ 1.0898 , above its 100 Daily moving average @ 1.0768 and above its 200 Daily moving average @ 1.0848
| Trends | Trends.1 | |
|---|---|---|
| 0 | Daily SMA20 | 1.0984 |
| 1 | Daily SMA50 | 1.0898 |
| 2 | Daily SMA100 | 1.0768 |
| 3 | Daily SMA200 | 1.0848 |
The previous day high was 1.0987 while the previous day low was 1.0936. The daily 38.2% Fib levels comes at 1.0955, expected to provide resistance. Similarly, the daily 61.8% fib level is at 1.0967, expected to provide resistance.
Note the levels of interest below:
- Pivot support is noted at 1.0929, 1.0907, 1.0878
- Pivot resistance is noted at 1.098, 1.1009, 1.1031
| Levels | Levels.1 |
|---|---|
| Previous Daily High | 1.0987 |
| Previous Daily Low | 1.0936 |
| Previous Weekly High | 1.1004 |
| Previous Weekly Low | 1.0910 |
| Previous Monthly High | 1.1140 |
| Previous Monthly Low | 1.0724 |
| Daily Fibonacci 38.2% | 1.0955 |
| Daily Fibonacci 61.8% | 1.0967 |
| Daily Pivot Point S1 | 1.0929 |
| Daily Pivot Point S2 | 1.0907 |
| Daily Pivot Point S3 | 1.0878 |
| Daily Pivot Point R1 | 1.0980 |
| Daily Pivot Point R2 | 1.1009 |
| Daily Pivot Point R3 | 1.1031 |
[/s2If]
Nehcap Trading Strategies
The NEHCAP currently runs the following trading systems for clients. They can be bought and run on your funds.
The system is trading live: LIVE ACCOUNT TRACKING
Contact Us: Contact
The HFT_FIX can be run free for 2 weeks on any broker with a ECN. Apply for a free trial
Join Our Telegram Group
")


