European stocks broadly shed value on Monday, STOXX600 falls half a percent. (Pivot Orderbook analysis)
…
This is a premium post.
[s2If !current_user_can(access_s2member_level4)]Please register for FREE REGISTER to read full post below containing analysis. In case of any error or you think you are not able to read the full post below, please email us at support#nehcap.com [lwa][/s2If] [s2If current_user_can(access_s2member_level1)]
- European stocks broadly shed value on Monday, STOXX600 falls half a percent.
- Euro area Industrial Production fell once again in November.
- Rate movement hopes from the ECB continue to run into a hard wall from officials.
The pair currently trades last at 16609.06.
The previous day high was 16733.19 while the previous day low was 16570.49. The daily 38.2% Fib levels comes at 16671.04, expected to provide resistance. Similarly, the daily 61.8% fib level is at 16632.64, expected to provide resistance.
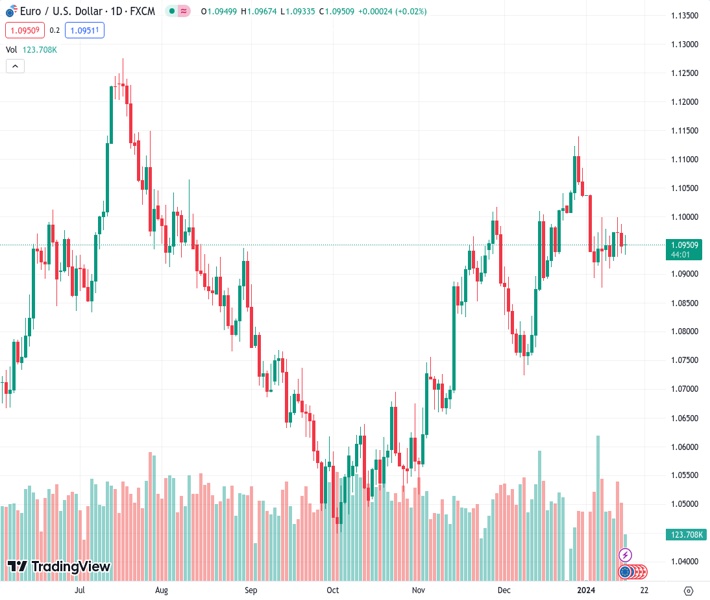
European shares broadly declined and major equity indexes shed weight to kick off the new trading week, walking back Friday’s gains.
With US markets shuttered for the Martin Luther King Day holiday, European shares backslid after euro area Industrial Production in December fell in-line with market forecasts at -0.3%, better than the previous period’s -0.7% but still another decline as economic conditions within Europe continue to deteriorate.
Germany’s Real Gross Domestic Product (GDP) Growth contracted by -0.3% in 2023, compared to the average yearly gain of 1.2% (2012 – 2022), adding further fuel to the fire and dragging the German DAX down half a percent on Monday.
European Central Bank (ECB) officials continue to talk down market expectations of rate cuts from the ECB as policymakers grapple with still-high inflation and wage pressures that make it difficult to justify rate cuts.
ECB officials and several euro area heads of state headed to Davos, Switzerland to kick off the World Economic Forum hosted at a luxury ski resort this week, which runs January 14 through 19.
This year’s WEF summit in Davos is titled “Rebuilding Trust”, and is set to focus on conversation topics including global trade, inflation, supply chains, AI technology, and Middle East geopolitical tensions.
The EUROSTOXX600 major equity index declined nearly 0.55% on Monday, falling 2.578 points to end at €474.19, while Germany’s DAX index shed 0.49% to end the day down 82.34 points at €16,622.22. France’s CAC 40 lost 53.46 points to close down 0.72% at €7,422.68, and London’s FTSE major index declined around 0.4% to end Monday’s trading at £7,594.91, down a hair over 30 points.
The DAX backslid on Monday, walking back Friday’s gains and sending Germany’s major equity index back below the 200-hour Simple Moving Average, (SMA), keeping German equities hamstrung in a consolidation pattern that has plagued the index since December and is beginning to see downside pressure mounting.
Despite struggling to find further topside momentum, the DAX remains deep inside bull territory after rebounding from October’s bottoms near €14,600, climbing nearly 14% and remaining within striking distance of new all-time highs at the €17,000 major price handle.
Technical Levels: Supports and Resistances
EURUSD currently trading at 16609.06 at the time of writing. Pair opened at 16684.14 and is trading with a change of -0.45 % .
| Overview | Overview.1 | |
|---|---|---|
| 0 | Today last price | 16609.06 |
| 1 | Today Daily Change | -75.08 |
| 2 | Today Daily Change % | -0.45 |
| 3 | Today daily open | 16684.14 |
The pair is trading below its 20 Daily moving average @ 16667.58, above its 50 Daily moving average @ 16231.19 , above its 100 Daily moving average @ 15802.52 and above its 200 Daily moving average @ 15860.69
| Trends | Trends.1 | |
|---|---|---|
| 0 | Daily SMA20 | 16667.58 |
| 1 | Daily SMA50 | 16231.19 |
| 2 | Daily SMA100 | 15802.52 |
| 3 | Daily SMA200 | 15860.69 |
The previous day high was 16733.19 while the previous day low was 16570.49. The daily 38.2% Fib levels comes at 16671.04, expected to provide resistance. Similarly, the daily 61.8% fib level is at 16632.64, expected to provide resistance.
Note the levels of interest below:
- Pivot support is noted at 16592.02, 16499.91, 16429.32
- Pivot resistance is noted at 16754.72, 16825.31, 16917.42
| Levels | Levels.1 |
|---|---|
| Previous Daily High | 16733.19 |
| Previous Daily Low | 16570.49 |
| Previous Weekly High | 16820.78 |
| Previous Weekly Low | 16501.46 |
| Previous Monthly High | 16984.44 |
| Previous Monthly Low | 16229.16 |
| Daily Fibonacci 38.2% | 16671.04 |
| Daily Fibonacci 61.8% | 16632.64 |
| Daily Pivot Point S1 | 16592.02 |
| Daily Pivot Point S2 | 16499.91 |
| Daily Pivot Point S3 | 16429.32 |
| Daily Pivot Point R1 | 16754.72 |
| Daily Pivot Point R2 | 16825.31 |
| Daily Pivot Point R3 | 16917.42 |
[/s2If]
Nehcap Trading Strategies
The NEHCAP currently runs the following trading systems for clients. They can be bought and run on your funds.
The system is trading live: LIVE ACCOUNT TRACKING
Contact Us: Contact
The HFT_FIX can be run free for 2 weeks on any broker with a ECN. Apply for a free trial
Join Our Telegram Group
")


