#EURGBP @ 0.85988 shows strength at 0.8600, up by 0.20%. (Pivot Orderbook analysis)
…
This is a premium post.
[s2If !current_user_can(access_s2member_level4)]Please register for FREE REGISTER to read full post below containing analysis. In case of any error or you think you are not able to read the full post below, please email us at support#nehcap.com [lwa][/s2If] [s2If current_user_can(access_s2member_level1)]
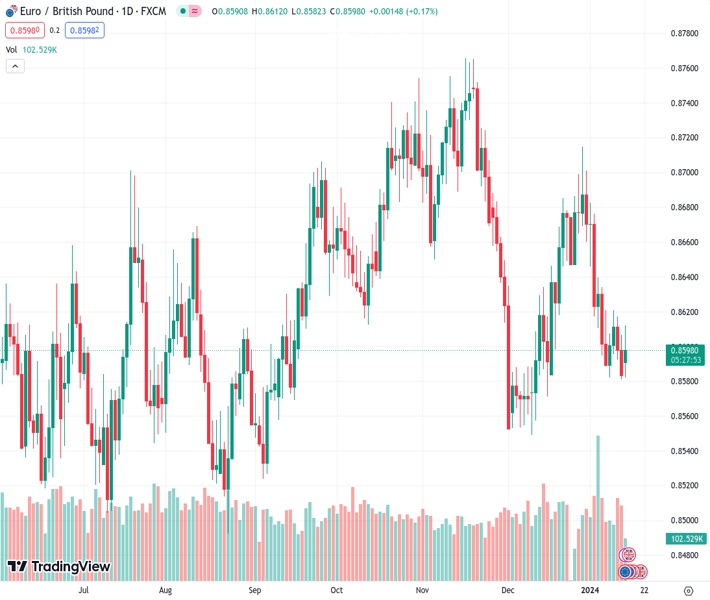
- EUR/GBP shows strength at 0.8600, up by 0.20%.
- Daily chart indicators highlight increased buying sentiment despite being negative territory.
- The position below main SMAs suggests underlining bear dominance in the long-term view.
The pair currently trades last at 0.85988.
The previous day high was 0.8607 while the previous day low was 0.8588. The daily 38.2% Fib levels comes at 0.8595, expected to provide support. Similarly, the daily 61.8% fib level is at 0.86, expected to provide resistance.
In Monday’s session, the EUR/GBP pair is seen trading at 0.8600 with a gain of 0.20% and hit a high of 0.8615. The daily chart presents a mixed sentiment leaning towards bearish, as the bears seem to take a breather after two days of losses. However, the strong support at 0.8600 has curbed further downside. Still, the bearish bias is more evident in the four-hour chart, with sellers trimming some daily gains, indicating a potential continuation of the downward trend for the rest of the session.
The indicators on the daily chart show that the bearish impulse is taking a breather. The Relative Strength Index (RSI) is indicating a positive slope while remaining under 50, signifying that the bears are not done just yet. The bearish pressure is further confirmed when observing the Moving Average Convergence Divergence (MACD), which prints flat red bards. In addition, the cross trades below the trio of 20, 100, and 200-day Simple Moving Averages (SMAs) indicate that the overall trend still favors the sellers.
In the four-hour chart, the bearishness is marked more notably. The tilt towards the negative side emerges stronger as the Relative Strength Index (RSI) shows a negative slope in negative territory. Also, the decreasing green bars of the MACD enforce the impression of the bull’s momentum being weak and transitory. Despite a brief pause in the bearish continuation, the selling force continues to have a prevailing grip on the market, suggesting an ongoing potential for further downside in the next sessions.
Technical Levels: Supports and Resistances
EURGBP currently trading at 0.8599 at the time of writing. Pair opened at 0.8593 and is trading with a change of 0.07 % .
| Overview | Overview.1 | |
|---|---|---|
| 0 | Today last price | 0.8599 |
| 1 | Today Daily Change | 0.0006 |
| 2 | Today Daily Change % | 0.0700 |
| 3 | Today daily open | 0.8593 |
The pair remains strongly bearish on the daily time frame. It trades below the 20 SMA @ 0.8641, 50 SMA 0.8652, 100 SMA @ 0.8649 and 200 SMA @ 0.8648.
| Trends | Trends.1 | |
|---|---|---|
| 0 | Daily SMA20 | 0.8641 |
| 1 | Daily SMA50 | 0.8652 |
| 2 | Daily SMA100 | 0.8649 |
| 3 | Daily SMA200 | 0.8648 |
The previous day high was 0.8607 while the previous day low was 0.8588. The daily 38.2% Fib levels comes at 0.8595, expected to provide support. Similarly, the daily 61.8% fib level is at 0.86, expected to provide resistance.
Note the levels of interest below:
- Pivot support is noted at 0.8585, 0.8577, 0.8566
- Pivot resistance is noted at 0.8604, 0.8614, 0.8622
| Levels | Levels.1 |
|---|---|
| Previous Daily High | 0.8607 |
| Previous Daily Low | 0.8588 |
| Previous Weekly High | 0.8621 |
| Previous Weekly Low | 0.8587 |
| Previous Monthly High | 0.8715 |
| Previous Monthly Low | 0.8549 |
| Daily Fibonacci 38.2% | 0.8595 |
| Daily Fibonacci 61.8% | 0.8600 |
| Daily Pivot Point S1 | 0.8585 |
| Daily Pivot Point S2 | 0.8577 |
| Daily Pivot Point S3 | 0.8566 |
| Daily Pivot Point R1 | 0.8604 |
| Daily Pivot Point R2 | 0.8614 |
| Daily Pivot Point R3 | 0.8622 |
[/s2If]
Nehcap Trading Strategies
The NEHCAP currently runs the following trading systems for clients. They can be bought and run on your funds.
The system is trading live: LIVE ACCOUNT TRACKING
Contact Us: Contact
The HFT_FIX can be run free for 2 weeks on any broker with a ECN. Apply for a free trial
Join Our Telegram Group
")


