The oil price rises significantly as airstrikes from the US and its allies on Houthi rebels have deepened supply disruption concerns. (Pivot Orderbook analysis)
…
This is a premium post.
[s2If !current_user_can(access_s2member_level4)]Please register for FREE REGISTER to read full post below containing analysis. In case of any error or you think you are not able to read the full post below, please email us at support#nehcap.com [lwa][/s2If] [s2If current_user_can(access_s2member_level1)]
- The oil price rises significantly as airstrikes from the US and its allies on Houthi rebels have deepened supply disruption concerns.
- The likelihood of a retaliation from Iran-backed Houthis is high, which could widespread conflicts in Middle East.
- Investors are optimistic about interest rate cuts by the Fed in March.
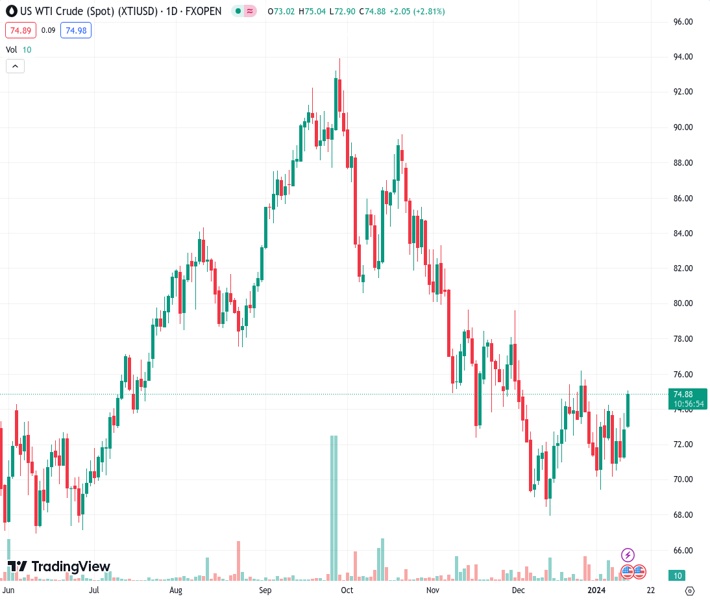
The pair currently trades last at 74.57.
The previous day high was 73.8 while the previous day low was 71.23. The daily 38.2% Fib levels comes at 72.82, expected to provide support. Similarly, the daily 61.8% fib level is at 72.21, expected to provide support.
West Texas Intermediate (WTI), futures on NYMEX, has climbed strongly to near $74.50 as investors worry about deepening oil supply concerns due to mounting tensions for merchant vessels through Red Sea. The US military has launched multiples airstrikes on Iran-backed Houthi group in retaliation for attacking commercial shipments of oil.
The airstrikes from the US military and its allies are expected to disrupt trade flows through Suez Canal and will also escalate Middle East tensions. A widespread conflict in the Middle East will elevate oil supply disruptions this 2024 and will keep prices of WTI higher.
The upside risks to oil prices have elevated amid a likelihood of oil supply disruption in times when the global economy is recovering from pessimism of restrictive interest rate environment and high price pressures.
Meanwhile, investors’ confidence towards a rate cut by the Federal Reserve (Fed) in March despite higher consumer price inflation has provided some strength to the oil price. A sharp recovery in the global economy is highly anticipated if the Fed plans an early rate cut as predicted by market participants. This will also spurt the global oil demand and eventually its prices.
Going forward, investors will focus on China’s Q4 Gross Domestic Product (GDP) and Industrial Production data for further action. The Chinese economy has been struggling for a firm-footing due to lower export orders and vulnerable domestic demand post Covid. It is worth noting that China is the leading importer of oil in the world and an economic slowdown in the Asian giant impacts the oil price.
Technical Levels: Supports and Resistances
XTIUSD currently trading at 74.57 at the time of writing. Pair opened at 72.47 and is trading with a change of 2.9 % .
| Overview | Overview.1 | |
|---|---|---|
| 0 | Today last price | 74.57 |
| 1 | Today Daily Change | 2.10 |
| 2 | Today Daily Change % | 2.90 |
| 3 | Today daily open | 72.47 |
The pair is trading above its 20 Daily moving average @ 72.79, above its 50 Daily moving average @ 74.15 , below its 100 Daily moving average @ 80.07 and below its 200 Daily moving average @ 77.6
| Trends | Trends.1 | |
|---|---|---|
| 0 | Daily SMA20 | 72.79 |
| 1 | Daily SMA50 | 74.15 |
| 2 | Daily SMA100 | 80.07 |
| 3 | Daily SMA200 | 77.60 |
The previous day high was 73.8 while the previous day low was 71.23. The daily 38.2% Fib levels comes at 72.82, expected to provide support. Similarly, the daily 61.8% fib level is at 72.21, expected to provide support.
Note the levels of interest below:
- Pivot support is noted at 71.2, 69.93, 68.64
- Pivot resistance is noted at 73.77, 75.06, 76.33
| Levels | Levels.1 |
|---|---|
| Previous Daily High | 73.80 |
| Previous Daily Low | 71.23 |
| Previous Weekly High | 74.28 |
| Previous Weekly Low | 69.41 |
| Previous Monthly High | 76.79 |
| Previous Monthly Low | 67.97 |
| Daily Fibonacci 38.2% | 72.82 |
| Daily Fibonacci 61.8% | 72.21 |
| Daily Pivot Point S1 | 71.20 |
| Daily Pivot Point S2 | 69.93 |
| Daily Pivot Point S3 | 68.64 |
| Daily Pivot Point R1 | 73.77 |
| Daily Pivot Point R2 | 75.06 |
| Daily Pivot Point R3 | 76.33 |
[/s2If]
Nehcap Trading Strategies
The NEHCAP currently runs the following trading systems for clients. They can be bought and run on your funds.
The system is trading live: LIVE ACCOUNT TRACKING
Contact Us: Contact
The HFT_FIX can be run free for 2 weeks on any broker with a ECN. Apply for a free trial
Join Our Telegram Group
")


