#USDJPY @ 146.013 The US Dollar broadly climbed on Thursday after US CPI inflation broadly beat the street. (Pivot Orderbook analysis)
…
This is a premium post.
[s2If !current_user_can(access_s2member_level4)]Please register for FREE REGISTER to read full post below containing analysis. In case of any error or you think you are not able to read the full post below, please email us at support#nehcap.com [lwa][/s2If] [s2If current_user_can(access_s2member_level1)]
- The US Dollar broadly climbed on Thursday after US CPI inflation broadly beat the street.
- US Initial Jobless Claims also improved, US labor market looking stubbornly firm.
- Japan Current Account, US PPI still due for Friday.
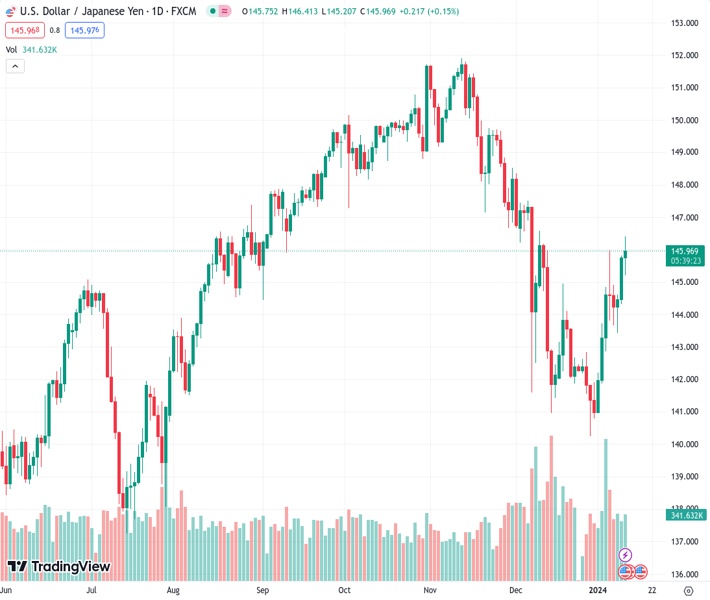
The pair currently trades last at 146.013.
The previous day high was 145.84 while the previous day low was 144.32. The daily 38.2% Fib levels comes at 145.26, expected to provide support. Similarly, the daily 61.8% fib level is at 144.9, expected to provide support.
The USD/JPY climbed early in Thursday’s US market session after US Consumer Price Index (CPI) inflation numbers broadly beat market forecasts, with inflation stepping higher in December and completely swamping out market hopes for signs that rate cuts would be impending soon.
US CPI inflation climbs to 3.4% in December vs. 3.2% expected
US headline CPI inflation for the year ended December came in at 3.4% versus the market forecast of 3.2%, handily climbing over the previous period’s 3.1. December’s MoM CPI came in higher than expected at 0.3% versus the forecast 0.2%, and climbing further over November’s 0.1% print.
US Initial Jobless Claims for the week ended January 5 also came in better than expected, printing at 202K versus the anticipated 210K, though the previous week did see a slight upside revision to 203K (pre-revision 202K).
The US Dollar (USD) caught a broad-market bid after the CPI inflation print as market hopes of impending rate cuts from the Federal Reserve dashed on the rocks of rising inflation metrics. Many investors were hoping for inflation to cool at least enough to keep the dream of a March rate cut alive, with money markets pricing in a 60% chance of a March rate cut as recently as yesterday.
The week isn’t over yet, and the USD/JPY still has to grapple with Japanese Trade Balance and Current Account figures due early Friday, while US producer-facing inflation will be printing tomorrow. The US Producer Price Index (PPI) for December is expected to tick slightly higher from 0.0% to 0.1%, while annualized Core PPI for the year ended December is expected to clip lower from 2.0% to 1.9%.
The USD/JPY rose to a near-term high of 146.41 before falling back into Thursday’s intraday levels with the US Dollar getting driven higher against the already-softening Japanese Yen (JPY). With the USD/JPY continuing to test higher, the 200-hour Simple Moving Average (SMA) is set to continue climbing through the 144.00 handle, building out an intraday technical floor.
Daily candlesticks have the USD/JPY running into near-term technical resistance at the 50-day SMA descending into 146.00, and prices are caught on the topside of the 200-day SMA approaching 144.00, with USD/JPY caught in the congestion zone of the two moving averages.
Technical Levels: Supports and Resistances
USDJPY currently trading at 145.71 at the time of writing. Pair opened at 145.8 and is trading with a change of -0.06 % .
| Overview | Overview.1 | |
|---|---|---|
| 0 | Today last price | 145.71 |
| 1 | Today Daily Change | -0.09 |
| 2 | Today Daily Change % | -0.06 |
| 3 | Today daily open | 145.80 |
The pair is trading above its 20 Daily moving average @ 142.92, below its 50 Daily moving average @ 146.31 , below its 100 Daily moving average @ 147.4 and above its 200 Daily moving average @ 143.5
| Trends | Trends.1 | |
|---|---|---|
| 0 | Daily SMA20 | 142.92 |
| 1 | Daily SMA50 | 146.31 |
| 2 | Daily SMA100 | 147.40 |
| 3 | Daily SMA200 | 143.50 |
The previous day high was 145.84 while the previous day low was 144.32. The daily 38.2% Fib levels comes at 145.26, expected to provide support. Similarly, the daily 61.8% fib level is at 144.9, expected to provide support.
Note the levels of interest below:
- Pivot support is noted at 144.81, 143.81, 143.29
- Pivot resistance is noted at 146.32, 146.83, 147.83
| Levels | Levels.1 |
|---|---|
| Previous Daily High | 145.84 |
| Previous Daily Low | 144.32 |
| Previous Weekly High | 145.98 |
| Previous Weekly Low | 140.81 |
| Previous Monthly High | 148.35 |
| Previous Monthly Low | 140.25 |
| Daily Fibonacci 38.2% | 145.26 |
| Daily Fibonacci 61.8% | 144.90 |
| Daily Pivot Point S1 | 144.81 |
| Daily Pivot Point S2 | 143.81 |
| Daily Pivot Point S3 | 143.29 |
| Daily Pivot Point R1 | 146.32 |
| Daily Pivot Point R2 | 146.83 |
| Daily Pivot Point R3 | 147.83 |
[/s2If]
Nehcap investment funds
The NEHCAP currently runs the following trading investment systems for clients.
The system is trading live: LIVE ACCOUNT TRACKING
Contact Us: Contact
You can run it free. Apply for a free trial
Join Our Telegram Group
")


