#GBPJPY @ 185.662 ‘s modest gain reflects cautious market sentiment ahead of important UK economic releases. (Pivot Orderbook analysis)
…
This is a premium post.
[s2If !current_user_can(access_s2member_level4)]Please register for FREE REGISTER to read full post below containing analysis. In case of any error or you think you are not able to read the full post below, please email us at support#nehcap.com [lwa][/s2If] [s2If current_user_can(access_s2member_level1)]
- GBP/JPY’s modest gain reflects cautious market sentiment ahead of important UK economic releases.
- Technical analysis suggests bullish trend intact; breach above 186.00 could open path to 187.00 and 188.00 resistance levels.
- For a downward shift, sellers need to push the pair below 185.00, targeting the 183.39 low and 182.45 (Teknan-Sen).
The pair currently trades last at 185.662.
The previous day high was 185.68 while the previous day low was 183.42. The daily 38.2% Fib levels comes at 184.81, expected to provide support. Similarly, the daily 61.8% fib level is at 184.28, expected to provide support.
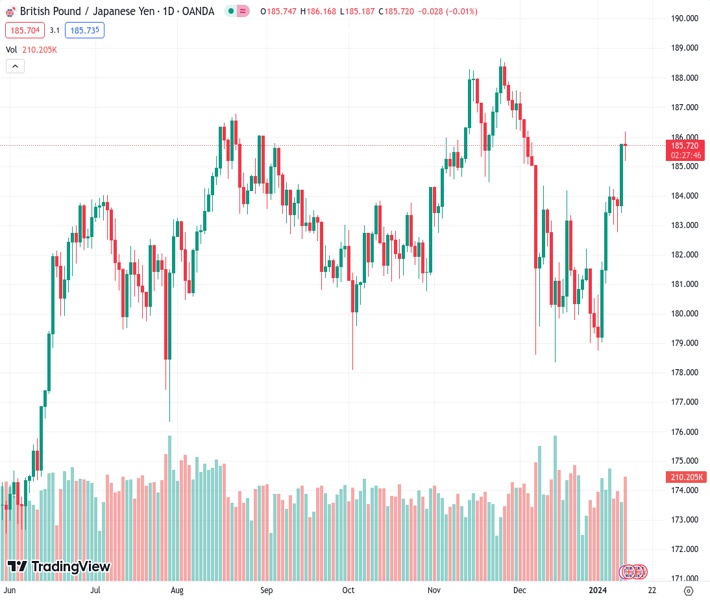
The British Pound posted minuscule gains of 0.08% late during the North American session on Thursday, though it’s exchanging hands below the 186.00 figure. The GBP/JPY trades at 185.86 after hitting a daily low of 185.77.
From a technical perspective, GBP/JPY price action remains constrained as traders seem to be waiting for the release of growth data in the United Kingdom (UK). Even though the rally was capped near the top of the Ichimoku Cloud (Kumo), slightly above 186.00, the pair remains bullish. Once buyers lift the exchange rate above the latter, the next resistance would emerge at the 187.00 figure, followed by the 188.00 mark.
On the other hand if sellers step in they must push prices below the 185.00 figure. Once done, they must reclaim the January 10 low of 183.39, followed by the Teknan-Sen at 182.45. A breach of the latter will expose the confluence of the Senkow Span A and the Kijun-Sen at around 182.35/26.
Technical Levels: Supports and Resistances
GBPJPY currently trading at 185.78 at the time of writing. Pair opened at 185.67 and is trading with a change of 0.06 % .
| Overview | Overview.1 | |
|---|---|---|
| 0 | Today last price | 185.78 |
| 1 | Today Daily Change | 0.11 |
| 2 | Today Daily Change % | 0.06 |
| 3 | Today daily open | 185.67 |
The pair remains strongly bullish on the daily timeframe. It trades above its 20 SMA @ 181.61, 50 SMA 183.97, 100 SMA @ 183.42 and 200 SMA @ 179.93.
| Trends | Trends.1 | |
|---|---|---|
| 0 | Daily SMA20 | 181.61 |
| 1 | Daily SMA50 | 183.97 |
| 2 | Daily SMA100 | 183.42 |
| 3 | Daily SMA200 | 179.93 |
The previous day high was 185.68 while the previous day low was 183.42. The daily 38.2% Fib levels comes at 184.81, expected to provide support. Similarly, the daily 61.8% fib level is at 184.28, expected to provide support.
Note the levels of interest below:
- Pivot support is noted at 184.17, 182.67, 181.92
- Pivot resistance is noted at 186.42, 187.18, 188.68
| Levels | Levels.1 |
|---|---|
| Previous Daily High | 185.68 |
| Previous Daily Low | 183.42 |
| Previous Weekly High | 184.33 |
| Previous Weekly Low | 178.74 |
| Previous Monthly High | 187.52 |
| Previous Monthly Low | 178.35 |
| Daily Fibonacci 38.2% | 184.81 |
| Daily Fibonacci 61.8% | 184.28 |
| Daily Pivot Point S1 | 184.17 |
| Daily Pivot Point S2 | 182.67 |
| Daily Pivot Point S3 | 181.92 |
| Daily Pivot Point R1 | 186.42 |
| Daily Pivot Point R2 | 187.18 |
| Daily Pivot Point R3 | 188.68 |
[/s2If]
Nehcap Trading Strategies
The NEHCAP currently runs the following trading systems for clients. They can be bought and run on your funds.
The system is trading live: LIVE ACCOUNT TRACKING
Contact Us: Contact
The HFT_FIX can be run free for 2 weeks on any broker with a ECN. Apply for a free trial
Join Our Telegram Group
")


